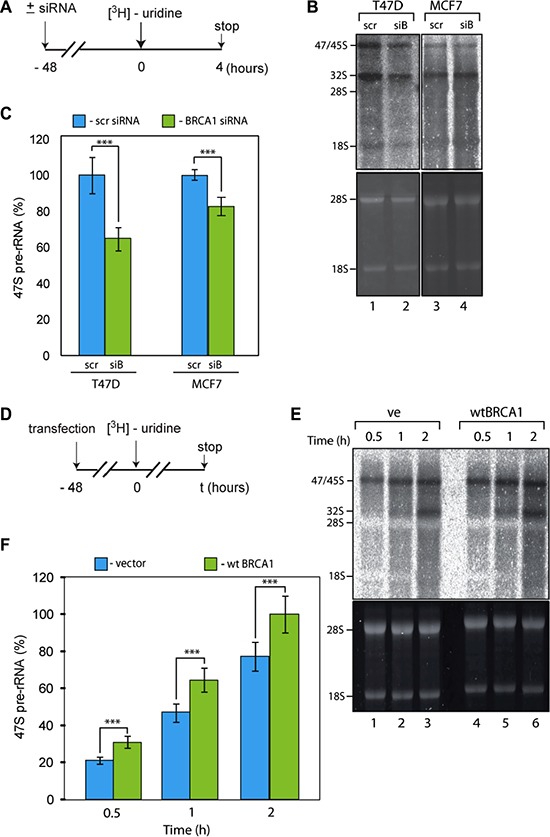
Figure 3. BRCA1 positively regulates rRNA synthesis in cells.

(A) Schematic representation of the labelling of cells with 3H-uridine to determine the effect of BRCA1 depletion on ongoing rRNA synthesis. (B) RNA was extracted 4 hours after 3H-uridine addition and de novo rRNA transcripts were detected by tritium imaging of RNA blots (top panel). Total 18 S and 28 S rRNAs were detected by ethidium bromide staining (bottom panel). (C) To determine the relative efficiencies of rRNA synthesis, RNA blots were imaged using tritium image plate (Fuji) and quantitated with the aid of phosphoimager (Fuji) and Aida software (Raytec). Transcript levels are indicated for 47 S pre-rRNA. The data are expressed as a percentage of the highest value (set at 100%). Standard deviations and statistical significance are shown; ***p < 0.001. P-values have been calculated using one and two-way ANOVA on R software; n = 3. (D) Schematic representation of the labelling of cells with 3H-uridine to determine the effect of BRCA1 reconstitution on ongoing rRNA synthesis. HCC1937 cells expressing inactive BRCA1 mutant were transfected by construct carrying wt BRCA1. 3H-uridine was added 48 hours post-ransfection. (E) RNA was extracted 1 and 2 hours after 3H-uridine addition and de novo rRNA transcripts were detected by tritium imaging of RNA blots (top panel). Total 18 S and 28 S rRNAs were detected by ethidium bromide staining (bottom panel). (F) To determine the relative efficiencies of rRNA synthesis, RNA blots were imaged using tritium image plate (Fuji) and quantitated with aid of phosphoimager (Fuji) and Aida software (Raytec). Transcript levels are indicated for 47 S pre-rRNA. The data are expressed as a percentage of the highest value (set at 100%); Standard deviations and statistical significance are shown; ***p < 0.001; P-values have been calculated using one and two-way ANOVA on R software; n = 3.
