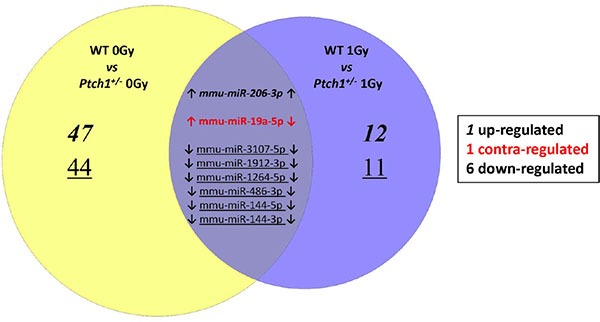
Figure 1. Venn Diagram describes the overlap between the statistically significant miRNAs perturbed in the unirradiated (left) and 1 Gy irradiated (right) Ptch1+/− GCPs when compared to the corresponding WT GCPs.

The common miRNAs have been explicitly subclassified into both up-regulated (bold), down-regulated (underlined) or contra-regulated (red).
