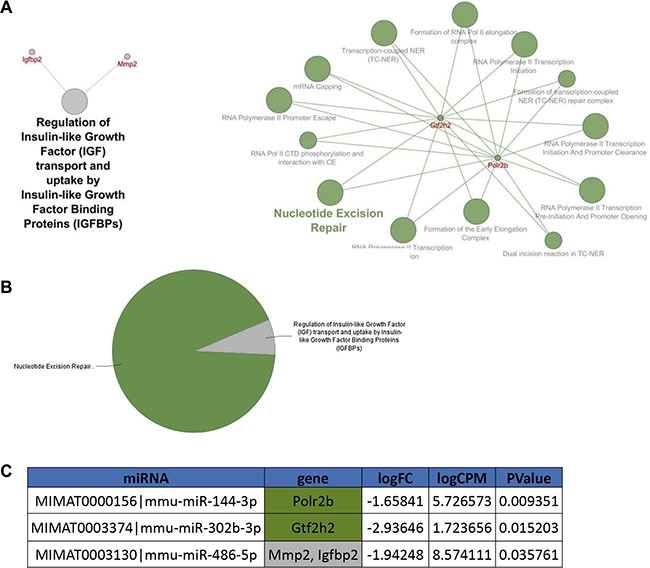
Figure 3. Pathway enrichment analysis was performed on the statistically significant miRNAs altered 4 hours after 1 Gy of X-rays in Ptch1+/− GCPs versus WT GCPs (listed in Table 2).

(A) mRNAs and corresponding Reactome pathways predicted to be altered by the deregulated miRNAs. (B) Pie chart showing the main pathways associated to the mRNA network. (C) The table highlights the miRNAs predicted to target the genes shown in the network in panel A, alongside with their log2 Fold Change, log2 Count Per Million and p-value.
