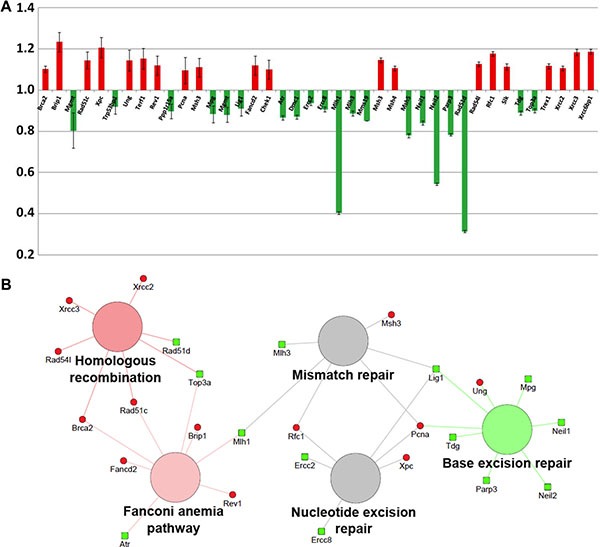
Figure 4. Analysis of statistically significant (P < 0.05) mRNAs involved in the DNA damage response in the Ptch1 +/− GCPs after 1 Gy of X-rays with respect to the irradiated WT counterpart.

(A) Histogram of all significant genes and their corresponding fold change (error bars represent the standard deviations). (B) Network showing the pathway enrichment analysis of up-regulated (red) and down-regulated (green) genes. Colors of the pathway nodes reflect the number of associated genes up- or down-regulated: green if mostly down-regulated, red if mostly up-regulated and gray if equally divided.
