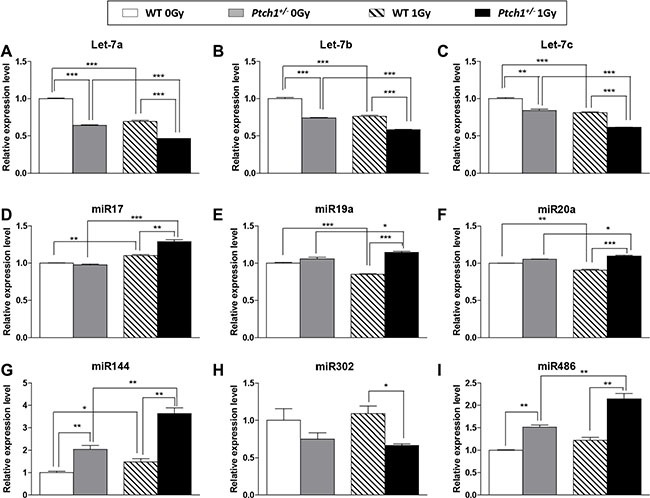
Figure 7. Real time PCR validation on GCPs of selected statistically significant miRNAs from NGS and arrays.

Each data represent the mean and the standard deviation of three biological replicates with respect to the unirradiated WT GCPs. Student's t-test has been performed to calculate the statistical significance of comparisons. *P ≤ 0.05; **P ≤ 0.005; ***P ≤ 0.0001.
