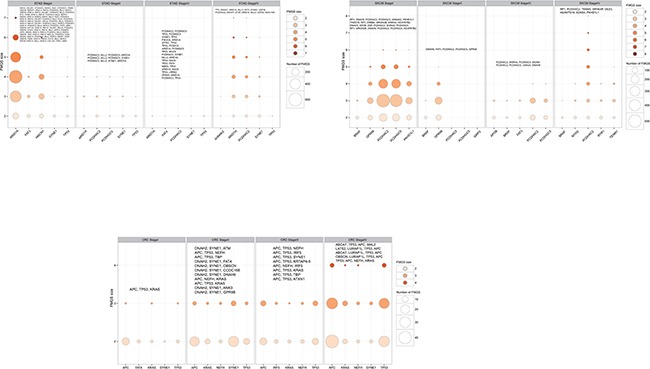
Figure 3. Number of FMGS with different size among the top five highest mutation genes in each clinical stages in selected cancers: CRC, SKCM, and STAD.

The bubble size corresponding to the number of FMGS and the color corresponding to the FMGS size, respectively. The largest FMGS in each stage was shown in the top of bubble plot and genes that identical to the top five highest mutation ones were shaded in bold font.
