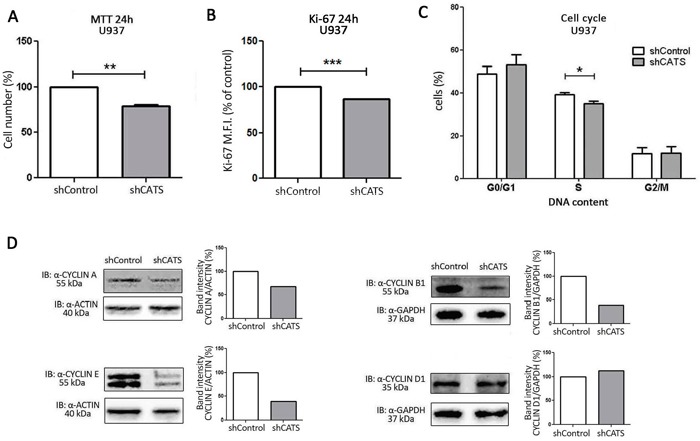
Figure 2. CATS knockdown reduces proliferation of U937 cells in vitro.

Cell proliferation was determined A. by MTT assay after 24h of normal culture conditions. Results are shown as mean ± SD of three independent sixplicates experiments. B. Ki-67 mean of fluorescence intensity (M.F.I.) determined by flow cytometry after 24h incubation of shCATS and normalized by shControl cells. Results are shown as mean ± SD of three independent experiments. C. Percentage of cells on different cell cycle phases determined by flow cytometry. Results are shown as mean ± SD of three independent triplicate experiments. D. Western blot analysis of shControl and shCATS total cell extracts. Membrane was blotted against anti-CYCLIN A, anti-CYCLIN E, anti-CYCLIN B1, anti-CYCLIN D1, and anti-ACTIN or anti-GAPDH, as a control for equal sample loading. The bar graphs represent densitometric analysis of blots relative to control set as 100% (UN-SCAN-IT software). *p<0.05; **p<0.01, ***p< 0.001, Student's t test.
