
Figure 3. Expression of DNAM-1, natural cytotoxicity receptors and CD16 are also reduced on NK cells from patients with B-CLL.
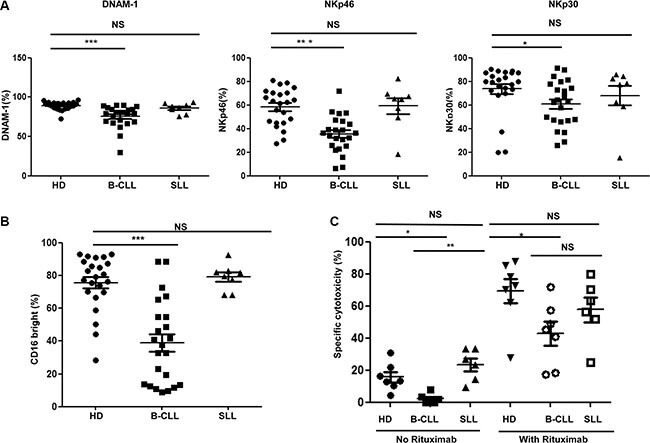
(A) The surface expression of DNAM-1 (left panel), NKp46 (middle panel) and NKp30 (right panel) was determined on NK cells from 23 healthy donors (HD), 23 patients with B-CLL and 8 patients with SLL were studied using flow cytometry. Data shown are mean values for the percentage of cells positive for each receptor within HD, patients with B-CLL and patients with SLL. Error bars represent standard errors and significance was determined using Mann-Whitney testing, p < 0.05(*) and p < 0.001(***). (B) The expression of CD16 was determined on NK cells from 23 HD, 23 patients with B-CLL and 8 patients with SLL using flow cytometry. Data shown are mean values of the percentage of CD16 bright populations of NK cells from HD, patients with B-CLL and patients with SLL. Error bars represent standard errors and significance was determined using Mann-Whitney testing, p < 0.001(***). (C) For the rituximab induced NK cytotoxicity assay, B-CLL primary tumor cells were enriched and used as target cells. The target cells were then incubated NK cells, with or without Rituximab, for 16 hours. Specific lysis was calculated according to the relative cell counting using flow cytometry. Data shown are mean values of the specific cytotoxicity by NK cells from 7 HD, 7 patients with B-CLL and 6 patients with SLL. Error bars represent standard errors and significance was determined using Mann-Whitney testing, P < 0.05(*), and P < 0.01(**).