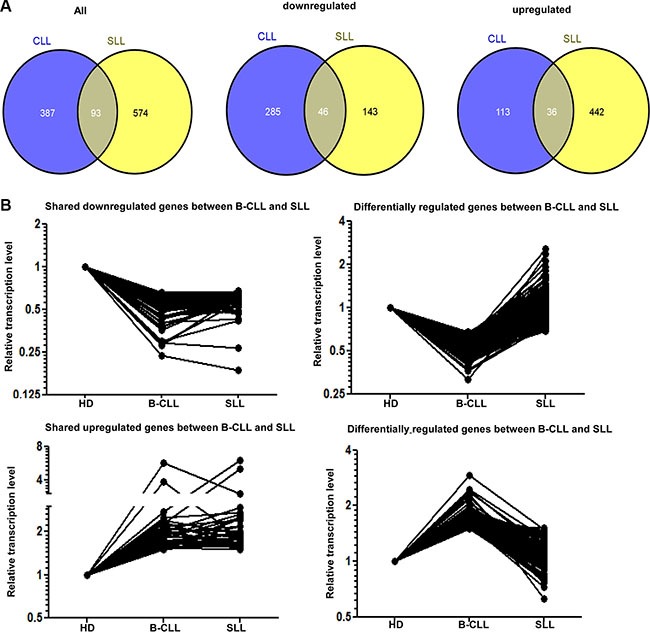
Figure 4. The transcription profile of NK cells in patients with B-CLL or SLL compared to healthy donors.

(A) Venn diagram demonstrating the intersection of genes significantly modified in NK cells from patients with B-CLL or SLL compared to healthy donors (HD) in microarray analysis. The number of genes which show any significant change is shown in the left panel and the number of downregulated or upregulated genes are shown in the middle and right panels respectively. (B) Graphical representation of the relative transcriptional level of similarly or differentially expressed genes in NK cells from patients with B-CLL or SLL compared to HD. 46 genes are downregulated in NK cells from both patients with B-CLL and SLL compared with HD (top left graph) and 36 genes are upregulated in these groups (bottom left graph). 285 genes are downregulated in NK cells from patients with B-CLL compared to HD but not in patients with SLL (top right graph) whereas 113 genes are upregulated in NK cells from patients with B-CLL compared to HD, but not in patients with SLL (bottom right graph).
