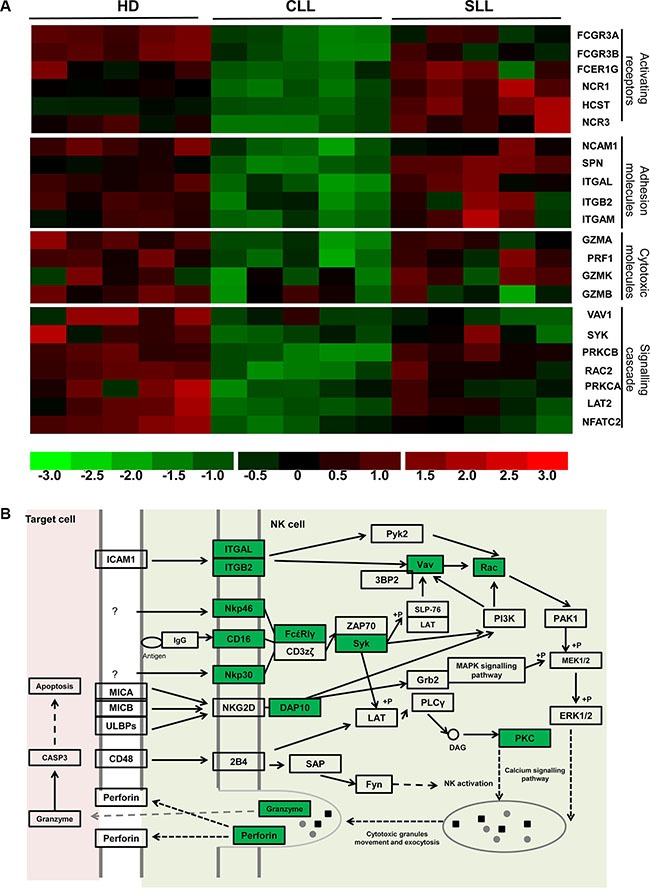
Figure 5. Multiple points in the cytotoxicity pathway of NK cells are impaired in patients with B-CLL.

(A) This demonstrates the relative intensity profile of 22 genes related to NK cytoxic function which are downregulated in NK cells from patients with B-CLL compared to HD. Each column represents one sample, whilst each row represents the relative hybridization intensity of an individual gene. The 22 transcripts were classified into 4 categories (From the top to the bottom): NK activating receptors (6 genes), adhesion molecules (5 genes), cytotoxic molecules (4 genes) and intracellular signal transduction related molecules (7 genes). The colour on the heatmap indicates the magnitude of the relative expression of genes across the samples, with brighter red indicating higher expression and brighter green indicating lower expression. (B) The NK cell cytotoxicity pathway (adapted from KEGG pathways analysis). Highlighted genes in green are those that have been shown to be significantly downregulated in patients with B-CLL compared to HD.
