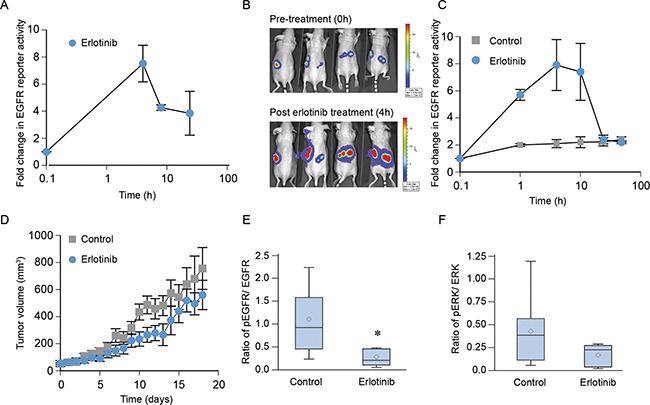
Figure 7. Erlotinib blocks EGFR phosphorylation in vivo in NCI-H1975 xenografts but not affect tumor growth.

A. Cells were treated with 3 μM erlotinib or DMSO (control) and bioluminescence activity was recorded after 10 min of treatment up to 24 h. Data were normalized to control values and plotted as mean ± SEM. B. In vivo bioluminescence activity was obtained from nude mice bearing NCI-H1975-BER flank tumors before and after treatment with erlotinib at the indicated time points. C. Fold change in EGFR reporter activity was calculated using the pre-treatment values as the baseline and plotted as mean ± SEM. D. Animals were randomized into two groups (n=5) and given either 100 mg/kg of erlotinib or saline as described in Materials and Methods. Tumor volume was measured daily, and tumor volume was plotted as the mean ± SEM (p=0.97). E–F. On day 18, mice were treated with 100 mg/kg erlotinib, and 4 h post-treatment animals were euthanized and their tumors were harvested. Tumor cell lysates were prepared using a standardized protocol and immunoblotted using phospho EGFR, total EGFR, phospho ERK, total ERK with GAPDH used as a loading control. The ratio of pEGFR/EGFR (panel E, p= 0.02) or pERK/ERK (panel F, p=0.14) from control (8 tumors) and erlotinib (6 tumors) treated specimens are represented using the box plot.
