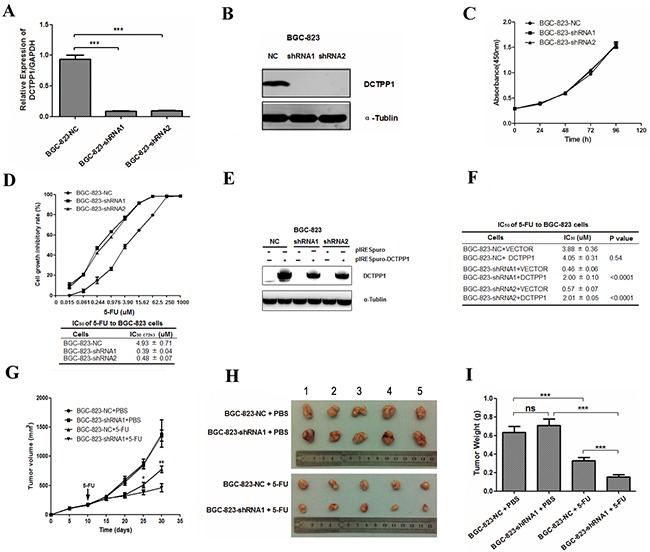
Figure 1. DCTPP1 knockdown in BGC-823 cells and its effects on cell proliferation upon 5-FU treatment.

A. DCTPP1 expressions in DCTPP1-knockdown and control BGC-823 cells were determined by real-time PCR with GAPDH as an internal reference. B. DCTPP1 expressions in BGC-823 cells were determined by Western blot. C. In vitro cell proliferation curves of DCTPP1-knockdown and control BGC-823 cells detected by CCK-8 assay. D. Upper: cell proliferation inhibitory curves of DCTPP1-knockdown and control BGC-823 cells upon 5-FU treatment. Lower: IC50 values of DCTPP1-knockdown and control BGC-823 cells upon 5-FU treatment for 72 h in vitro. E. DCTPP1 expression was determined by Western blot analysis in BGC-823-NC, BGC-823-shRNA1 and BGC-823-shRNA2 cells transiently transfected with DCTPP1 gene. F. IC50 values of DCTPP1-knockdown and control BGC-823 cells with rescue expression of DCTPP1 upon 5-FU treatment for 72 h. G. Tumor growth curves of BGC-823 cells in nude mice. Nude mice were injected subcutaneously with 3 × 10⁶ cells/mouse. When the volumes of tumors reached 180-200 mm3, the mice were intraperitoneally injected with 5-FU (25 mg/kg) or PBS. Tumor volumes were measured every five days for 4 weeks (n = 5). H. Xenograft tumors were stripped from nude mice and imaged. I. Tumor weights were assessed after sacrifice (n = 5 in each group). All the values shown were represented as means ± SD. (ns: not significant; *: P < 0.05; **: P < 0.01; ***: P < 0.001 vs control by two-tailed Student's t-test).
