
Figure 2.
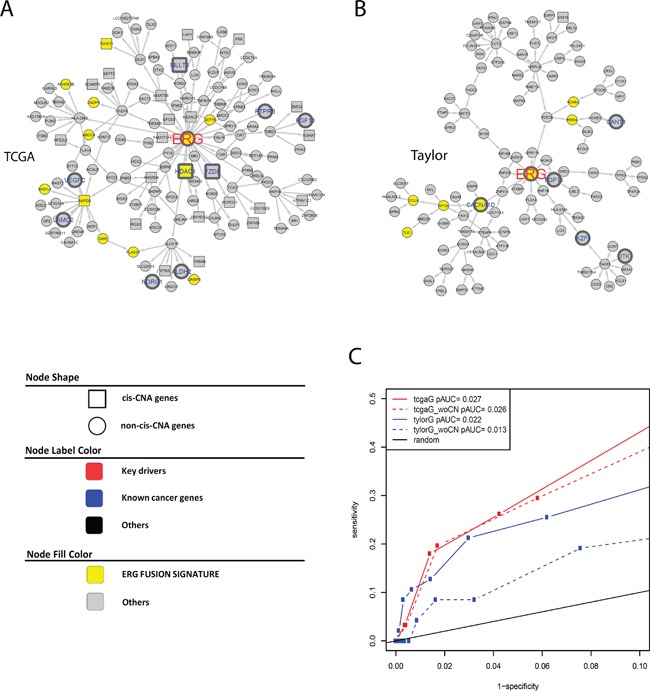
A and B. ERG subnetworks extracted from TCGA IMBN (A) and Taylor IMBN (B). Nodes of yellow color represent previously identified ERG fusion signature genes. Genes known to be cancer related are labeled in larger font size with blue color (nodes with thicker boarder). Square nodes represent genes regulated by cis CNA. C. The accuracy of ERG subnetworks is assessed using previously identified ERG fusion signature genes.