
Figure 6. NLGN4Y is a regulator of BCR.
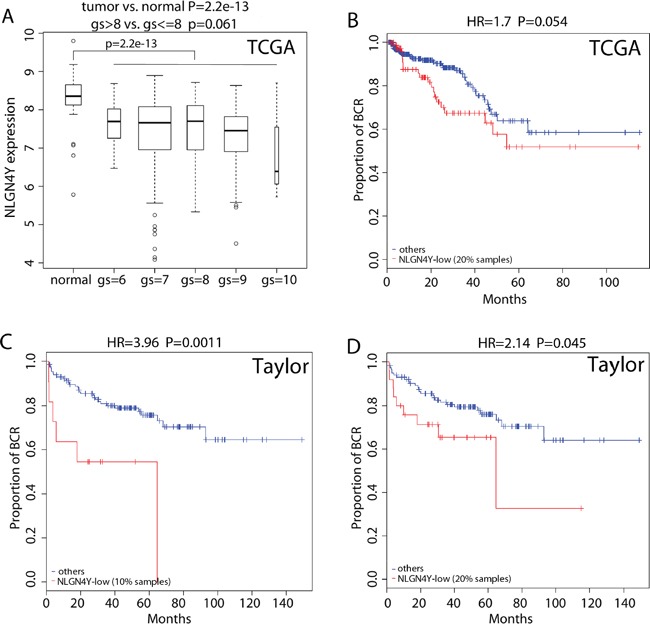
A. Boxplot of NLGN4Y expression in PCa samples with different gleason scores (gs) as well as normal prostate samples. B-D. Kaplan-Meier curves of BCR for patients with lower and higher expression of NLGN4Y in the TCGA dataset (B) and the Taylor dataset using different splitting of low and high (C and D). P-values were calculated by log rank test.