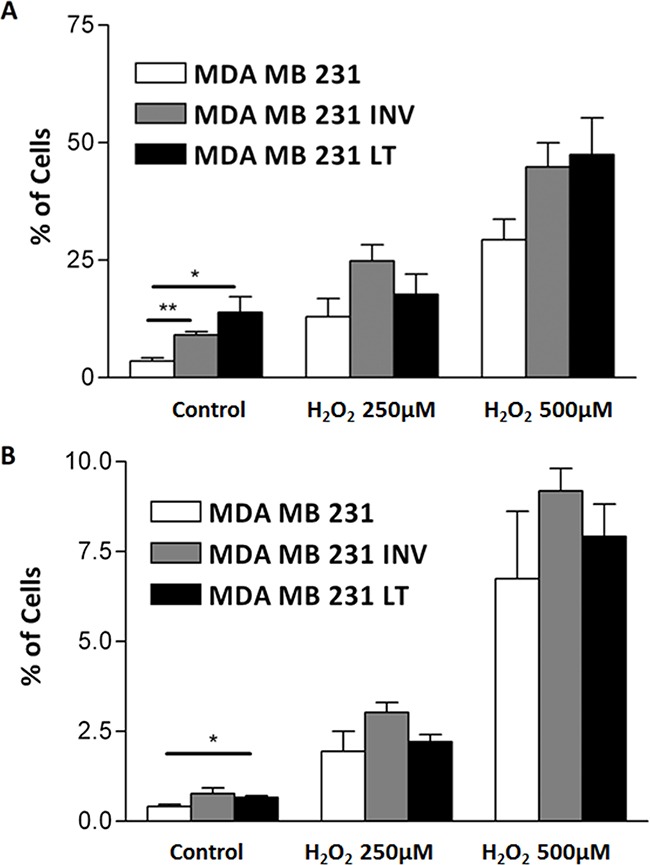
Figure 3. Analysis of spontaneous and induced apoptosis.

Spontaneous (Control) and with 250μM or 500μM H2O2 induced apoptosis A. and necrosis B. were measured by flow cytometry after Annexin-V-FLUOS staining of 231, INV and LT cells. INV and LT cells show significantly increased spontaneous apoptosis as compared to 231 cells. The response to superoxide also showed a slight increase that did not reach significance.
