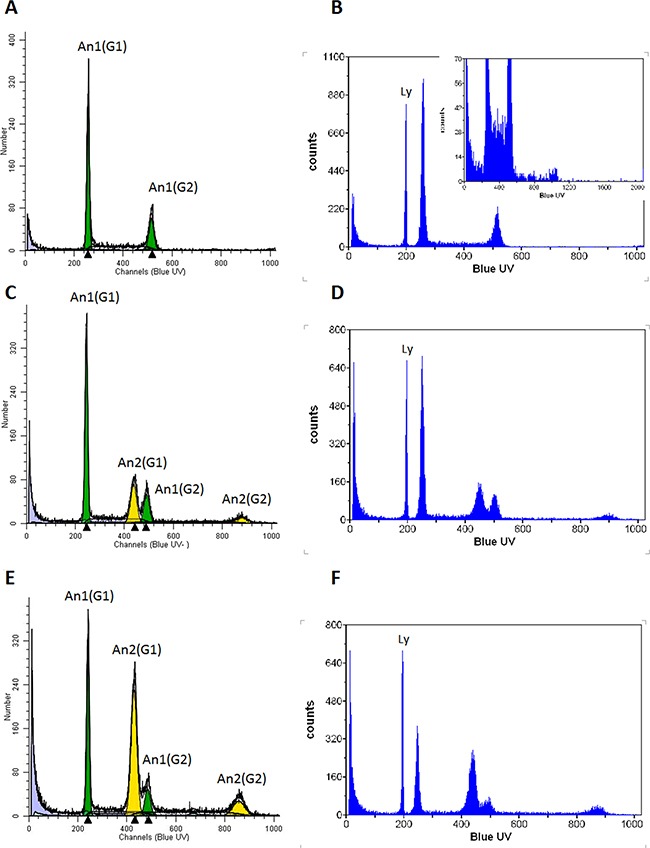
Figure 4. Flow cytometric determination of DNA content.

231 A, B. INV C, D. and LT E, F. cells were analyzed after DAPI staining for their DNA content. The G1 peak of 231 cells shows 1.3 times the content of normal human lymphocytes (Ly; indicated in panels B,D,F), compatible with reports of the chromosome content of these cells (aneuploid clone 1, AN1). The inclusion of channels over 1000 for cells with higher DNA content (insert in B) shows the presence of a small population with higher DNA content approximately twice that of the G2/M phase of AN1 (aneuploidy clone 2, AN2). The AN1 population is shown in green, the AN2 population in yellow. Both populations show their G1 and G2/M peaks. The panels B,D and F show the same analysis with the addition of human female lymphocytes with the normal diploid human genome for comparison.
