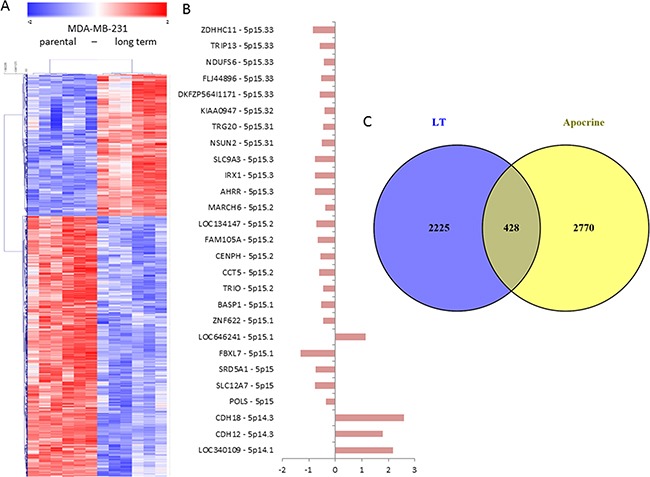
Figure 7. Gene expression profiling of 231 and LT cells.

A. Microarray gene expression profiles of 231 and LT cells were analyzed using SAM statistics. The expression values for significantly differentially expressed genes were clustered using hierarchical clustering (Pearson correlation distance measure, average linkage). Each column represents a single replicate of 231 or LT cells, each row represents a single probeset. Genes with expression values over the mean are shown in red, those with values below the mean in blue, mean = white. Clearly distinct expression patterns are observed for the two cell populations. B. The analysis of the genes from chromosome 5p among the significantly differentially expressed genes shows that most of them show reduced expression (left side of the axis) in LT cells as compared to 231 cells in concordance with the observed copy number gain in 231 cells. C. The analysis of bona fide targets of the inflammatory transcription factor NFkB among the genes that are significantly differentially expressed in LT cells shows that 12 of them are upregulated and 11 are down-regulated in LT cells as compared to 231 cells. D. The comparison of the genes differentially expressed in 231 cells with genes differentially expressed in apocrine breast cancers as compared to breast cancer of different subtypes [32] shows 428 genes that are common in both gene lists.
