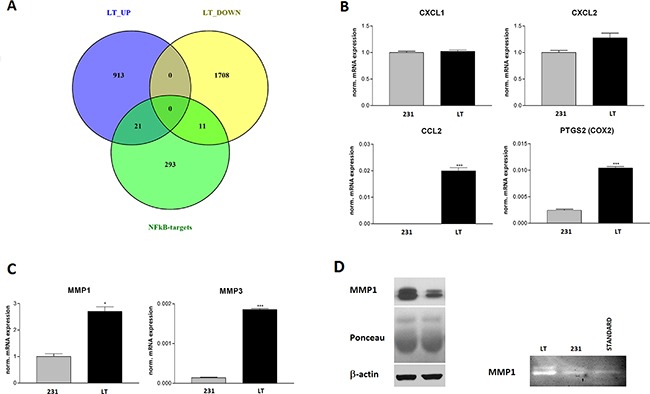
Figure 8. NFkB target validation.

A. Venn diagram of genes up- and down-regulated in LT versus 231 cells showing the overlap with experimentally validated NFkB target genes. B. Semi-quantitative real time PCR validation of the expression of the chemokines CXCL1 and -2, CCL2 and of COX2 (PTGS2) that are regulated by NFkB. C. Semi-quantitative real time PCR validation of MMP1 and MMP3 expression. D. Validation of MMP1 expression by Western blotting (loading controls: Poinceau red staining of the blot and β-actin Western blot). E. Zymography of serum free cell supernatants on gelatin containing gels. Standard = purified MMP1.
