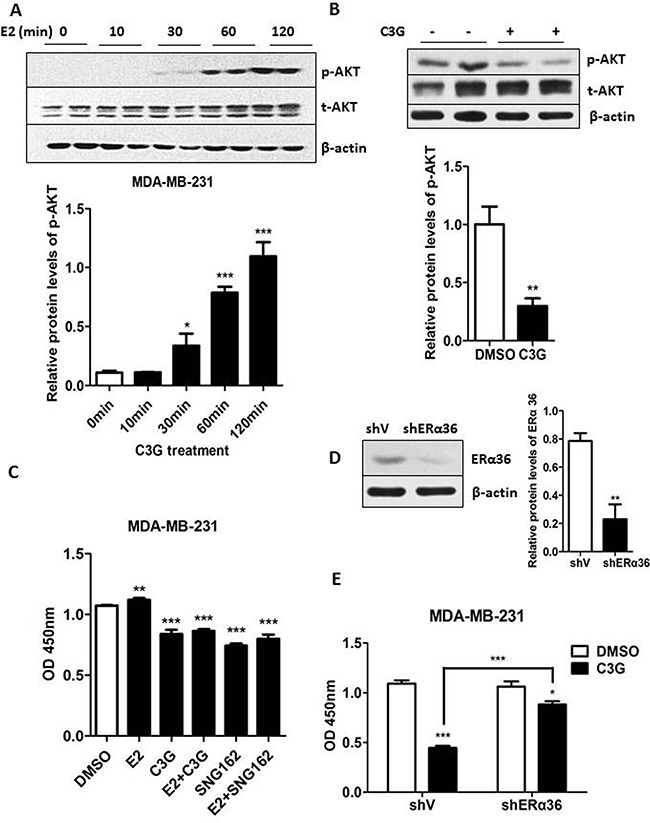
Figure 5. Cy-3-glu counteracts the estrogen-induced proliferation of MDA-MB-231 TNBC cells.

A. MDA-MB-231 cells were treated with E2 (100 nM) for the indicated time periods in FBS-free cell culture medium. The intensity of each band was quantified, and expressed as a percentage using the time 0 as reference. Upper panel, the expression of phosphorylated-AKT (p-AKT) and total AKT (t-AKT) were determined after E2 treatment. Lower panel, bar graphs show the relative protein levels of p-AKT/t-AKT. B. upper panel, the expression of t-AKT and p-AKT after Cy-3-glu (150 μM) treatment was determined. β-actin was used as the internal control. Lower panel shows the ratios of p-AKT/t-AKT. C. MDA-MB-231 cells proliferation was analyzed by the CCK-8 assay at 24 h. Cells were treated with 1 nM E2 and 500 μM Cy-3-glu, or E2 plus Cy-3-glu, or ERα36 inhibitor SNG162 or E2 plus ERα36 inhibitor SNG162, DMSO serves as the vehicle control. D. left panel, Western blot analysis of MDA-MB-231 cells transfected with a control vector (shV) and with the ER-α36 shRNA vector (shERα36). Right panel, bar graphs show the relative protein levels of ERα36. E. the proliferation of Cy-3-glu-induced MDA-MB-231 cells was analyzed after knock down of ERα36 by the shRNA method. The immunoblots shown here are from a representative experiment repeated three times with similar results. Differences with p < 0.05 (*), p < 0.01 (**) or p < 0.001(***) are considered statistically significant.
