
Figure 2. Forest plots of the overall outcome for overall survival (OS).
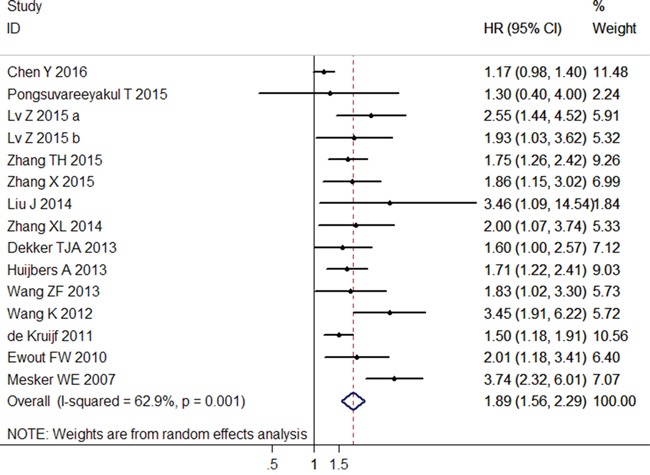
Hazard ratios (HRs) for each trial are represented by the squares, and the horizontal lines crossing the square stand for the 95% confidence intervals (CIs). The diamonds represent the estimated pooled effect of the overall outcome for OS in all solid tumors. All P values are two-sided.