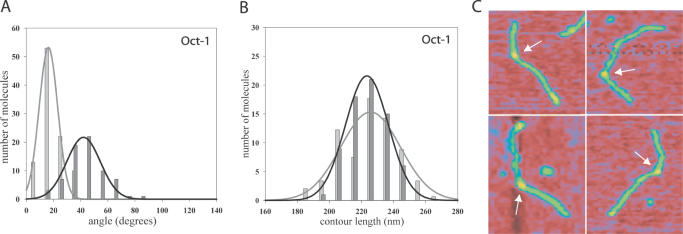
Figure 2.
Oct-1 induces a 42° bend when bound to the Ad5 origin DNA. Two histograms represent the DNA bend angle distributions (A) and contour length distributions (B) of the protein-free DNA molecules [light grey bars, data taken from Mysiak et al. (35)] and the Oct-1–DNA complexes (dark grey bars) measured by SFM. The grey and black lines represent the Gaussian fitting of the distribution as defined in equation 1 of Schulz et al. (39). A 717 bp DNA fragment was used that contains the Ad5 origin of replication with the middle of the Oct-1 recognition sequence at 35% of the DNA fragment. The mean values with standard deviations are presented in Table 1. (C) SFM images of the representative Oct-1–DNA complexes. The arrow indicates Oct-1 bound to DNA. Colour indicates height from 0 nm (red) to 1 nm (yellow).

