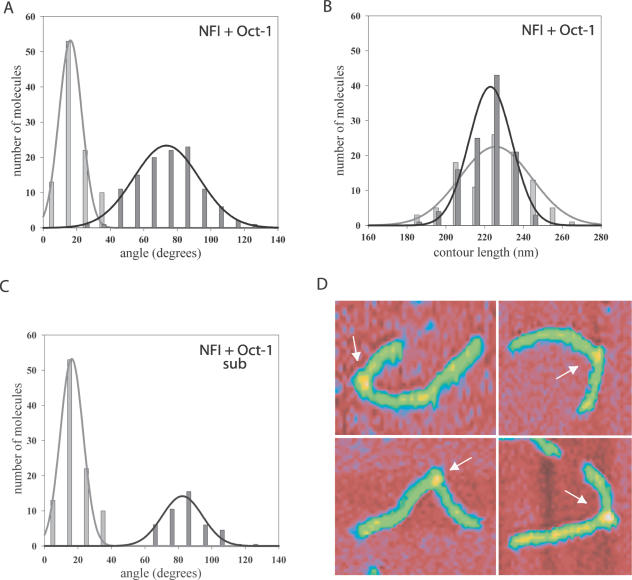
Figure 3.
The DNA bend angle increases when both NFI and Oct-1 are bound to the Ad5 origin DNA. The SFM data were collected in the presence of both NFI and Oct-1. The histograms represent DNA bend angle distributions (A) and contour length distributions (B) of the protein-free DNA molecules [light grey bars, data from Mysiak et al. (35)] and protein–DNA complexes (dark grey bars). The grey and black lines represent the Gaussian fitting of the distribution. The mean values with standard deviations are presented in Table 1. (C) The distribution of DNA bends induced by NFI alone [based on (35)] was subtracted from the NFI–Oct-1 distribution. (D) SFM images of the representative protein–DNA complexes. The arrow indicates proteins bound to DNA. Colour indicates height from 0 nm (red) to 1 nm (yellow).

