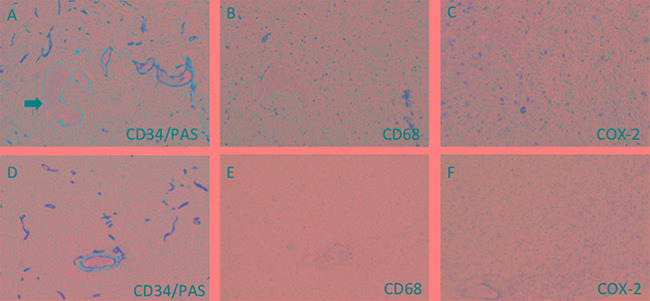
Figure 1. Immunohistochemistry of VM and macrophages in GBM samples.

A. Representative VM (arrow) and vessels (brown staining) in GBM. The VM was CD34−/PAS+ and showed purple, while the vessels were CD34+/PAS+and showed brown and purple. VM-positive regions showed much more numbers of macrophages (B) than that in VM-negative areas (E). In addition, VM-positive area revealed much higher COX-2 expression than those in VM-negative area (C, F). Original magnification: x200.
