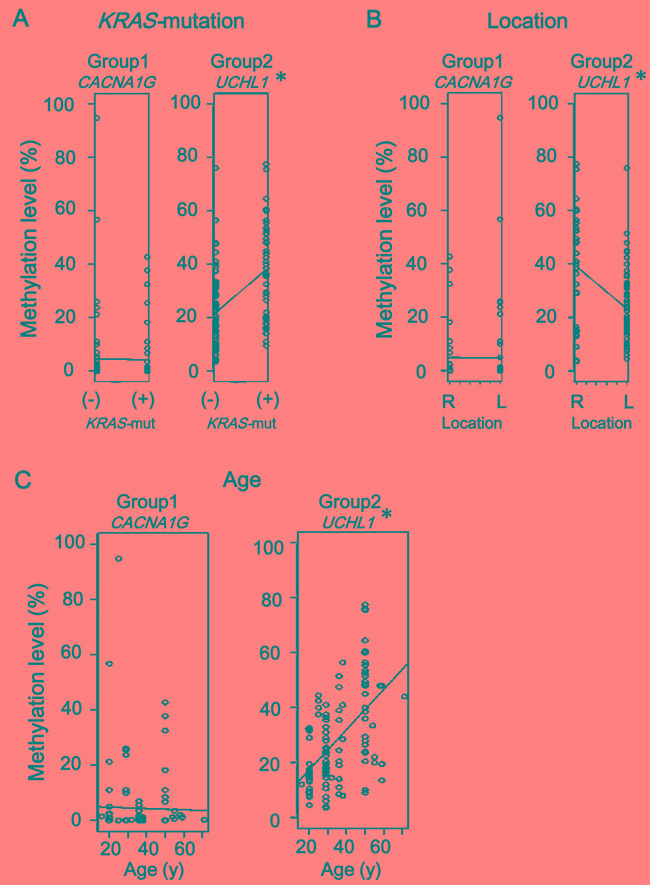
Figure 7. Comparison using linear single regression model.

A. Association of methylation accumulation with KRAS-mutation. Eight of 14 Group-2 markers, e.g., UCHL1, showed significant correlation between higher methylation level and KRAS-mutation(+) status, none of Group-1 markers did, e.g., CACNA1G. (See Supplementary Figure S1) B. Association of methylation accumulation with location. Five of 14 Group-2 markers, e.g., UCHL1, showed significant correlation between higher methylation level and proximal location, while none of Group-1 markers did, e.g., CACNA1G. (See Supplementary Figure S2) C. Association of methylation accumulation with age. Twelve of 14 Group-2 markers, e.g., UCHL1, showed a significant correlation between higher methylation level and age, while none of Group-1 markers did, e.g. CACNA1G. (See Supplementary Figure S3) Since six Group-1 markers and 14 Group-2 markers were evaluated for each factor, P-value < 0.008 (i.e., 0.05/6) and < 0.004 (i.e., 0.05/14) were considered significant, respectively, instead of P < 0.05 (*).
