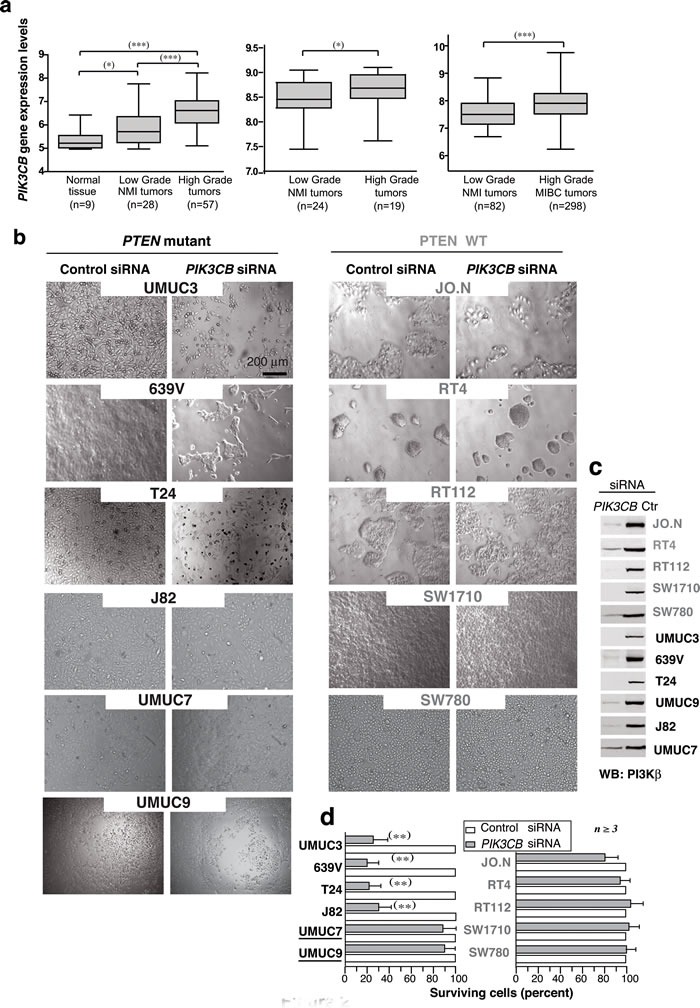
Figure 2. Advanced clinical UBC express high.

PIK3CB levels; PIK3CB depletion reduces cell survival in UBC lines. a. Box plots show PIK3CB gene expression (mean ± SEM) in clinical UBC. Gene expression data are expressed in log2 Robust Multichip Average (RMA) intensity units. Corresponding GEO accession numbers are GSE5287 (left panel) and GSM1838824 (center). The third dataset (right) is available from ArrayExpress (see Methods). MI, muscle-invasive; NMI, non-muscle invasive. For statistical analysis, we used the Kruskal-Wallis test with two-tailed Mann-Whitney post hoc test for paired group comparison; the one-tailed Mann-Whitney test was applied for group comparison. *** P ≤0.0001, ** P < 0.01, * P < 0.05. (b, c) Bladder carcinoma cell lines (0.5 x 10⁶ cells) were transfected on days 1 and 3 with 0.2 nmol control or siPIK3CB and were analyzed on day 5. Images show representative fields b. and WB analysis of tumor extracts c.. d. Percentage of surviving cells at experiment termination in siPIK3CB- vs. control siRNA-transfected cells (100%). ** P < 0.01 Student's t-test.
