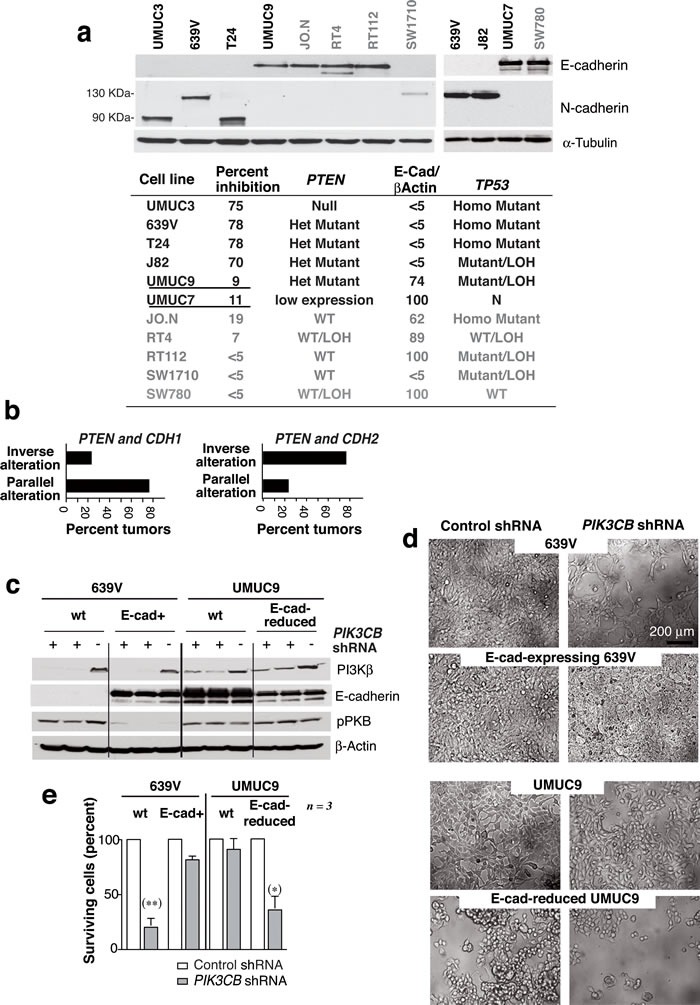
Figure 5. E-cadherin expression determines UBC line sensitivity to si.

PIK3CB. a. E-cad and N-cad levels in UBC cell line extracts were examined in WB. The table summarizes the E-cad/β-actin signal ratio relative to maximal levels (100%), the TP53 and PTEN mutational status, and the UBC cell responses to PI3Kβ silencing expressed as a percentage of cell survival inhibition (shown in Figure 2). Mutant PTEN, E-cad-high expressing cells are underlined. Het, heterozygous; Homo, homozygous; LOH, loss of heterozygosity; N, normal copy number. b. Graphs show UBC (from TCGA) with PTEN and CDH1 (E-cad) alterations or with PTEN and CDH2 (N-cad) alterations classified as tumors with parallel or inverse alterations in these genes (see Suppl. Figure S4). (c-e) 639V cells and 639V clones expressing E-cad were transfected with cDNA encoding doxy-inducible-control or -PIK3CB shRNA. Control and E-cad-depleted UMUC-9 cells were also transfected with control or inducible-PIK3CB shRNA. Extracts were tested in WB after doxy induction (5 µg/ml, 96 h) c.; images show representative fields d.. e. Percentage of cells after PIK3CB depletion (96 h) relative to controls. ** Student's t-test P < 0.01, *P < 0.05.
