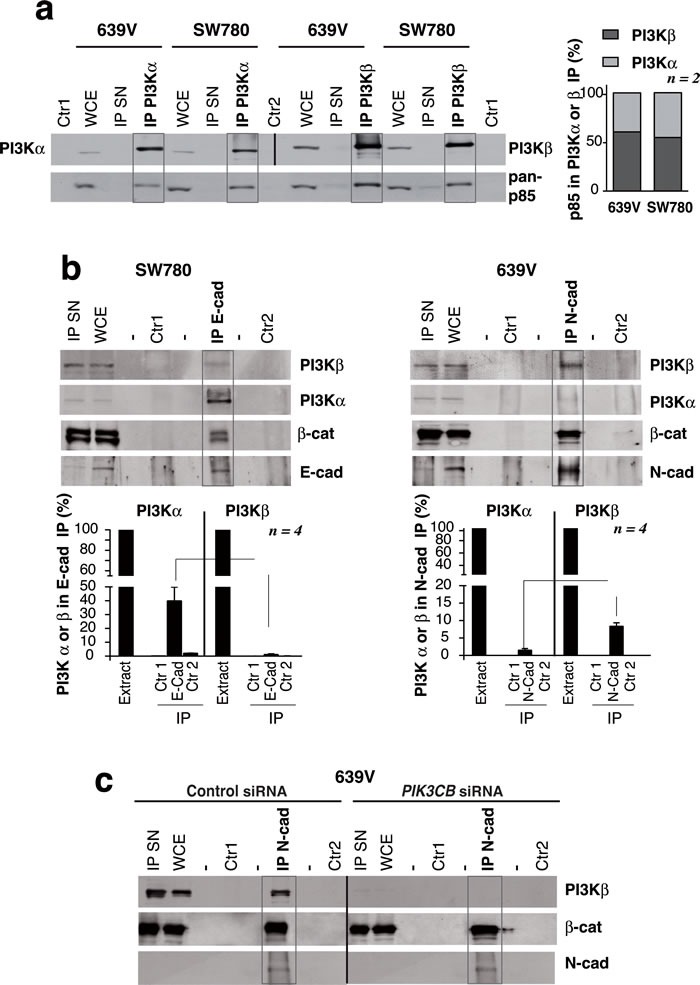
Figure 8. PI3Kβ associates with N-cadherin in.

PTEN mutant, E-cadherin-low UBC cells. a. Total extracts from 639V and SW780 cells (50 µg) or immunoprecipitates (IP) from these extracts (1 mg) were prepared with anti-PI3Kα or anti-PI3Kβ Ab and were tested in WB. PI3Kα IP and its controls were tested using PI3Kα Ab; PI3Kβ IP and its controls were blotted with PI3K Ab; all the samples were simultaneously examined with a pan-p85 Ab. Control 1 (Ctr1), non-specific signal in immunoprecipitates without antibody; Control 2 (Ctr2), lysis buffer incubated with antibody; IP SN, supernatant of IP (~30 µg). WB using pan-p85 Ab showed that 639V and SW780 cells had similar PI3Kα /PI3Kβ proportion as form both we isolated moderately higher amounts of p85/PI3Kβ than p85/PI3Kα complexes. The graph represents the percent of p85 signal (mean SEM) associated to PI3Kα or PI3Kβ referred to total p85 signal in both IP (100%) in each cell line. b. Extracts (900 µg) from 639V or SW780 cells were immunoprecipitated using N-cad or E-cad Ab, respectively; complexes were analyzed in WB. Total cell extracts (30 µg) were resolved in parallel. We quantitated the PI3Kα signal per µg in WCE (considered 100%) as well as PI3Kα signal per µg in the IP that was referred to maximal. We performed a similar quantitation of PI3Kβ signal. Graphs show the percent of PI3Kα (or of PI3Kβ signal) associated to cadherins in 639V or SW780 cells (mean SEM, n = 4). Controls as in a.. c. Specificity of the PI3Kβ band in complex with N-cad was tested as in b. using control or PI3Kβ-depleted 639V cell extracts. Controls as in a.. **P < 0.001, *P < 0.05; Student's t-test.
