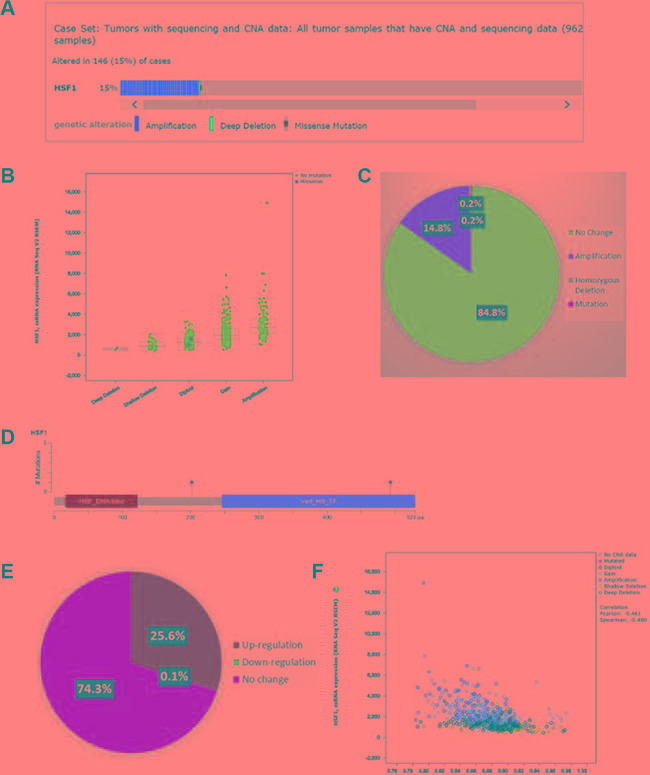
Figure 2. The cBio cancer genomics portal analysis.

Copy number alterations (CNAs) and Mutations of HSF1 in TCGA breast cancer dataset. (A) individual genes are represented as rows, individual cases or patients are represented as columns, and glyphs and/ or color-coding is used to compactly summarize distinct genomic alterations, including somatic mutations and copy number alterations (CNAs), (B) correlation of CNAs with HSF1 expression (RNA-seq), (C) the pie chart showing the frequency of genomic alterations and mutations, (D) mutation details for HSF1, (E) the pie chart showing the frequency of upregulated or downregulated gene expression, (F) correlation of methylation status (HM450) with mRNA expression (RNA-seq) of HSF1.
