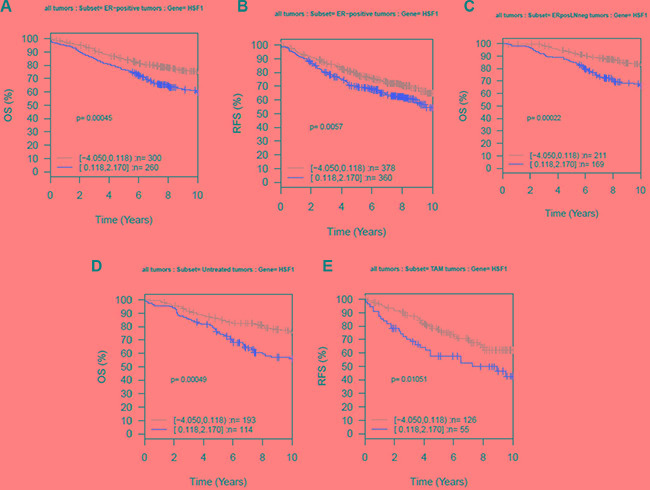
Figure 3. Kaplan-Meier analysis using the Affymetrix data sets (GOBO).

Ten-year (A) overall survival (OS) and (B) relapse-free survival (RFS) for ER-positive tumors, (C) ER-positive and lymph node (LN)-negative tumors, (D) OS for untreated tumors, and (E) RFS for tamoxifen (Tam)-treated tumors. The expression analysis was stratified into two quantiles based on HSF1 expression; low expression (gray) and high expression (red).
