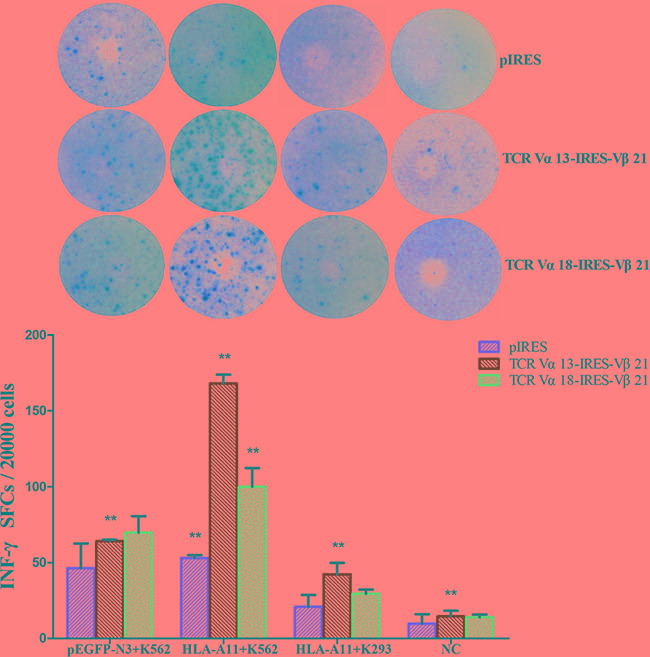
Figure 6. INF-γ levels in TCR Vα13-IRES-Vβ21 and TCR Vα18-IRES-Vβ21 transfected CD3+ T cells.

Three days after transduction, CD3+T cells transduced with pIRES, TCR Vα13-IRES-Vβ21 and Vα18-IRES-Vβ21 were co-cultured with pEGFP-N3+K562, HLA-A11+K562 , and HLA-A11+K293 cells plus a negative control at a 40:1 ratio for 6 hours. Then, The INF-γ was analyzed by ELISPOT array. *The Mann-Whitney test for two independent samples was used to determine differences between various groups. Statistical significance was defined as P < 0.05. ** , < 0.05. Error bars, S.D.
