
Figure 1. Hh inhibition in PCa cells.
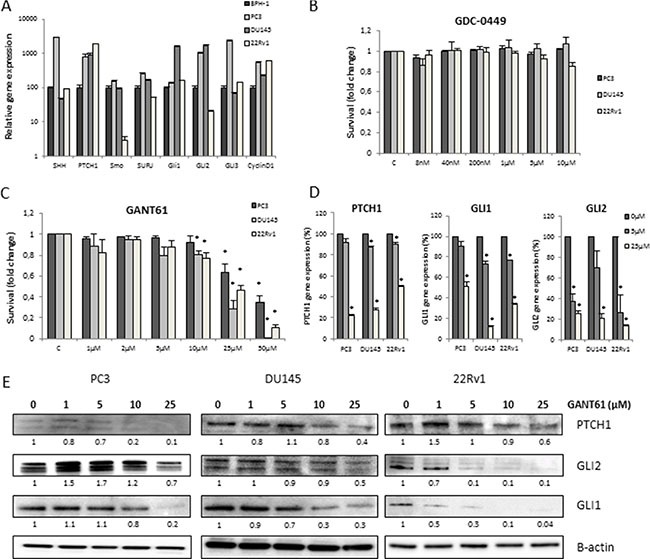
(A) Gene profiling of Hh signaling in BPH-1 (black), PC3 (dark grey), DU145 (light grey) and 22Rv1 (white) PCa cell lines. Means ± SEM of 2 independent experiments performed in triplicate. (B, C) Cytotoxity after 72 h GDC-0449 (B) and GANT61 (C) in PCa cell lines. Means ± SEM of 3 independent experiments performed in quadruplicate. *p < 0.05 vs. control. (D) Changes in gene expression after 72 h treatment with GANT61 (5 μM/25 μM) of PTCH1, GLI1 and GLI2. Means ± SEM of 2 independent experiments performed in triplicate. *p < 0.05 vs. control. (E) Effect of 72 h GANT61 on protein expression of PTCH1, GLI1 and GLI2. Protein expression levels of indicated proteins were also assessed by means of densitometry (relative values indicated below the blots).