
Figure 8. Western blotting analysis of MCF 7 cell line after 24 h of treatment with BAD-NE.
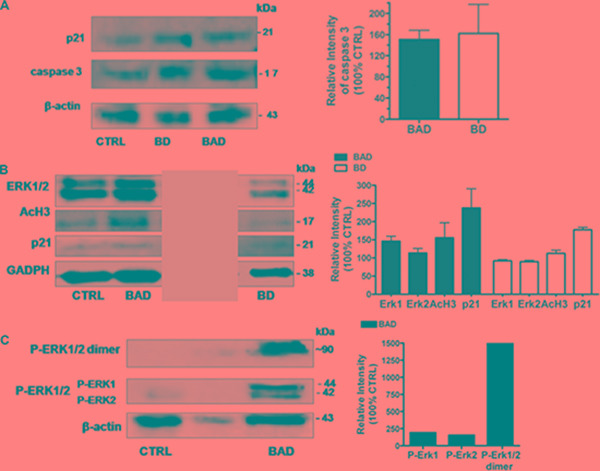
(A) Expression of cleaved form of caspase-3 and p21 protein after BAD-NE (BAD) and BD-NE (BD) treatment; (B) Expression of ERK1/2, AcH3, p21 and GAPDH proteins (gray box indicates to unrelated lanes on the same blot, see Figure 3S; (C) expression of phosphorylated form of ERK1/2, P-ERK1/2 dimer and β-actin proteins. The relative densitometries of the samples with respect to the control have been obtained after normalization of the concentrations with respect to GAPDH or β-actin concentrations. Each bar represents the ± SD of three experiments as biological replicas.