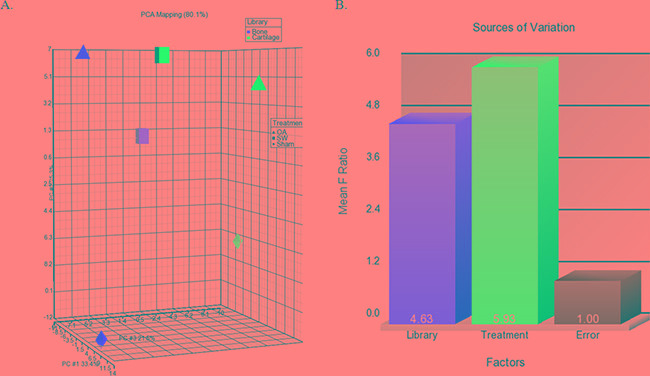
Figure 4. The profile of overall miRNAs expression changes.

A. The differential expression levels of miRNA in library (bone and cartilage) versus treatment groups (sham, OA and OA+SW). Each shape in the 3D visualization represents a group of miRNAs. Principal component analysis (PCA) captured 80.1% of the variation observed in the experiment in the first three principal components (PC). B. The source of the variation plot showed that the expression of miRNA in treatment groups of factor accounted for major of the variation.
