
Figure 1. Expression HIC1 and SIRT1 in papillary thyroid cancer tissue.
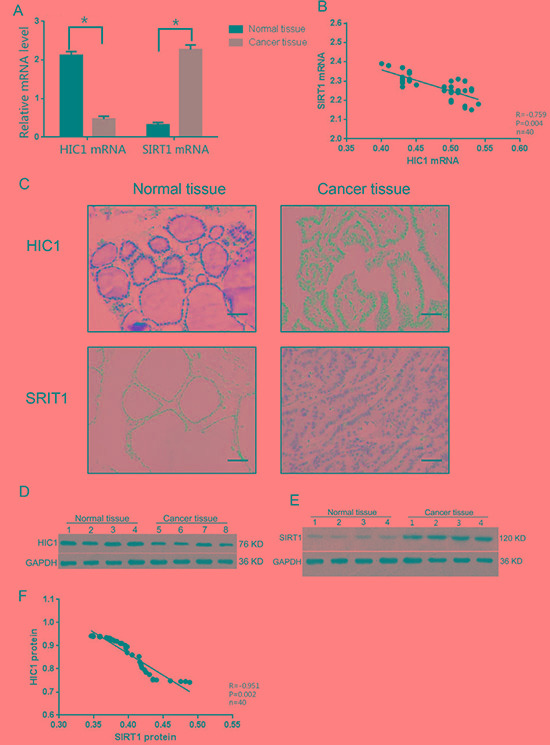
The mRNA and protein levels of HIC1 and SIRT1 were assessed in papillary thyroid cancer tissues and adjacent histologically normal tissue (n = 40 each) by qRT-PCR (A–B), immunohistochemistry, (Original magnification, 200×) Scale bar = 50 μm (C), and Western blot (D–F). Western blot was used to detect HIC1, SIRT1, and GAPHD expression. *p < 0.05 compared with noncancerous tissue with the Student's t-test. Pearson correlation analysis was used for panels B and F.