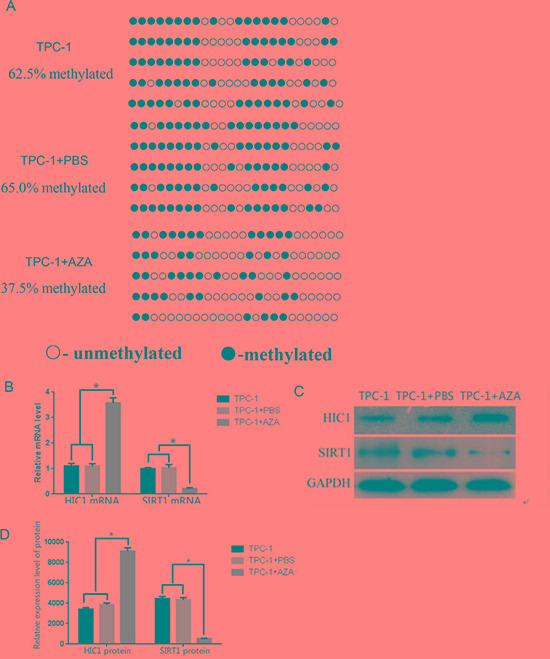
Figure 3. Effects of 5-aza-dC treatment on HIC1 and SIRT1 expression in TPC-1 cells.

(A) HIC1 promoter methylation was assessed in the presence and absence of the demethylating agent 5-aza-dC using BGS analysis in a human papillary thyroid cancer cell line (TPC-1 cells). Methylated sites are shown as filled circles, unmethylated sites as empty circles, and deletion or mutation sites as filled triangles. The percentage shown indicates the total methylation rate. (B) The mRNA expression levels of HIC1 and SIRT1 were assessed by qRT-PCR in TPC-1 cells treated with 5-aza-dC. *p < 0.05 compared to untreated TPC-1 cells or TPC-1 cells + PBS using a Student's t test. (C) HIC1 and SIRT1 protein expression by Western blot (D) Quantification of HIC1 and SIRT1 protein expression in TPC-1 cells after 5-aza-dC administration (n = 3). *p < 0.05 compared untreated TPC-1 cells or TPC-1 cells + PBS using a Student's t test. GAPDH was used as an internal control.
