
Figure 7. Correlation analysis of patients' overall survival and disease-free survival vs. expression of SOCS1, SOCS6, PTEN, and SOCS1/SOCS6/PTEN in NSCLC.
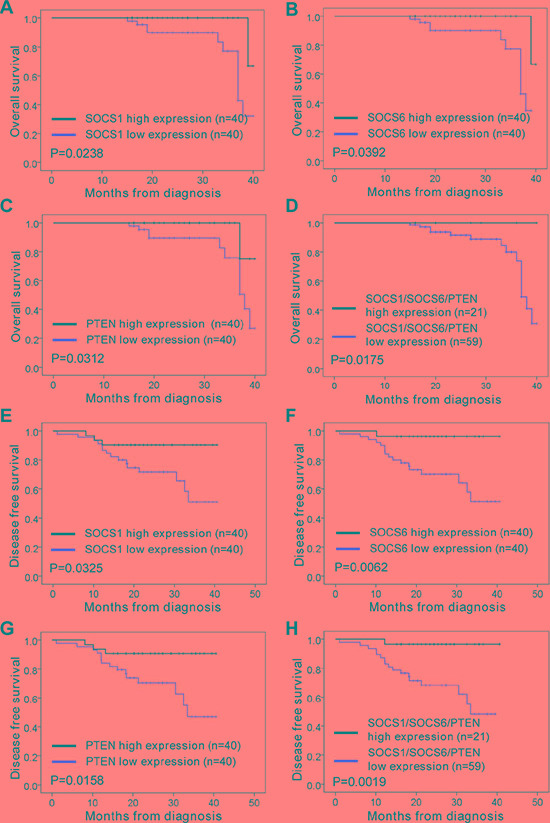
(A–D) The overall survival rates of patients with different levels of SOCS1 (A), SOCS6 (B), PTEN (C), and SOCS1/SOCS6/PTEN (D) in NSCLC. (E–H) The disease-free survival rate of patients with different levels of SOCS1 (E), SOCS6 (F), PTEN (G), and SOCS1/SOCS6/PTEN (H) in NSCLC.