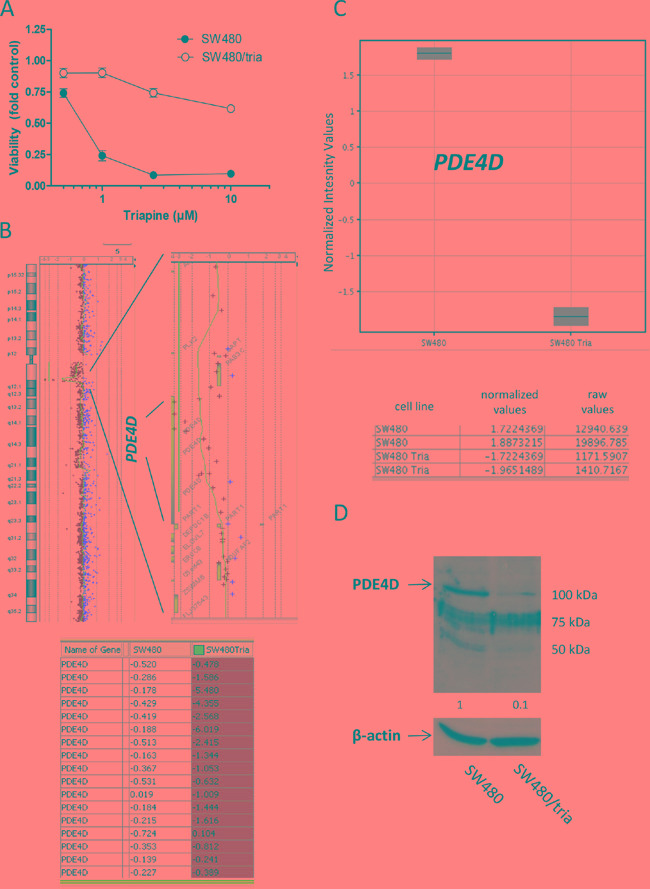
Figure 1. Characterization of a colon cancer cell line with acquired triapine resistance.

A. SW480 and SW480/tria cells were treated with the indicated concentrations of triapine. After 72 h treatment, cell viability was determined by MTT assay. The values given are means and standard deviations (SD) of one representative experiment out of three performed in triplicate. B. Gene dose changes of SW480/tria in comparison to SW480 cells were investigated by indirect aCGH (compare Supplementary Figure S1) using Cy5- and Cy3-labeled DNA, respectively. Results for whole chromosome 5 (left) are opposed to an enlarged region at 5q12 (right) containing the PDE4D gene. Each (+) indicates the position of one oligonucleotide within this region. Log2 ratios of Cy5-labeled SW480/tria and Cy3-labeled SW480 DNA of all PDE4D oligonucleotides on the microarray are listed at the bottom. C. mRNA expression levels for PDE4D in SW480 and SW480/tria cells were assessed by whole genome gene expression microarrays. Three independent PDE4D oligonucleotides were spotted on the array and gave comparable results. Data for oligonucleotide A_33_P3389653, recognizing all PDE4D mRNA splice variants, are shown. Normalized values for two replicates of SW480 and SW480/tria cells indicate massive downregulation of PDE4D mRNA in the SW480/tria as compared to the parental cell line. Raw values depict the absolute dye intensity (Cy3 or Cy5) measured for the PDE4D oligonucleotide on the microarray. D. PDE4D expression using total protein extracts of SW480 vs. SW480/tria cells was evaluated by Western blotting. β-actin was used as loading control.
