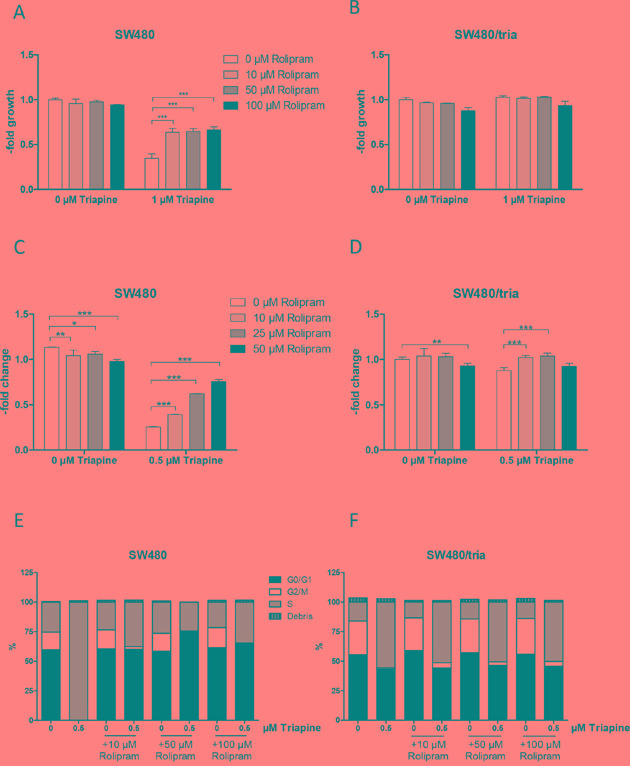
Figure 2. Impact of PDE4D inhibition on triapine response in SW480 and SW480/tria cells.

A and B. Cell viability of SW480 (A) and SW480/tria (B) cells treated for 72 h with the PDE4D inhibitor rolipram at the indicated concentrations alone and in combination with 1 μM triapine was determined by MTT assay. The values given are means and SD of one representative experiment out of three performed in triplicate. Statistical analysis was performed by two-way ANOVA (***P < 0.001). C and D. Colony formation potency of SW480 (C) and SW480/tria cells (D) treated with the indicated concentrations of rolipram alone and in combination with 0.5 μM triapine was evaluated. After 10 days of drug exposure cells were stained with crystal violet and quantified microscopically. The values given are means and SD of two experiments in duplicate. Statistical analysis was performed by Student's t-test (*P < 0.05, **P < 0.01, ***P < 0.001). E and F. Cell cycle distribution of SW480 (E) and SW480/tria cells (F) was determined after 24 h exposure to the indicated concentrations of triapine alone and in combination with rolipram. Propidium iodide staining and flow cytometric measurements were performed and percentages of cells in G0/G1, S, and G2/M phases are indicated.
