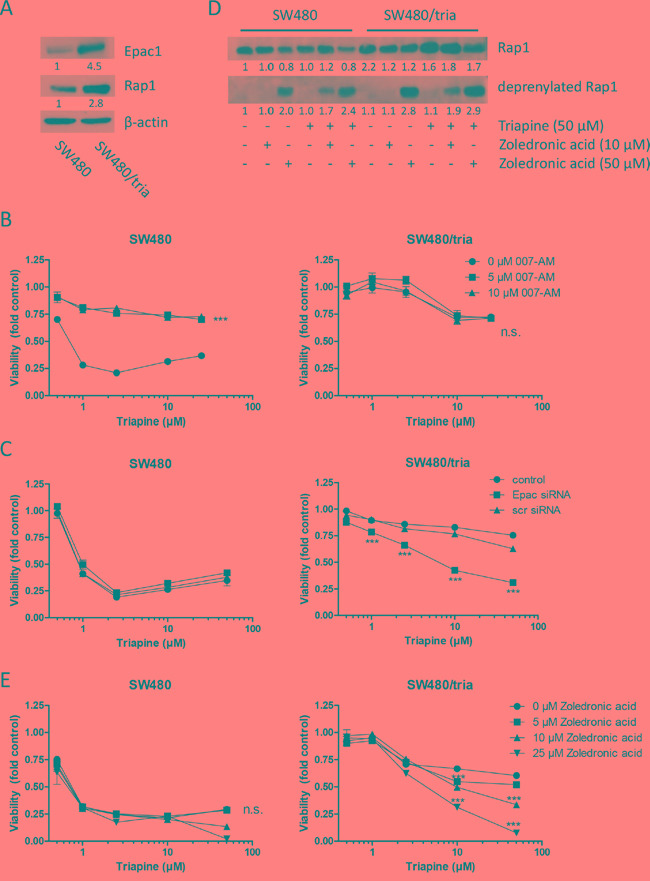
Figure 4. The Epac-Rap1 signaling axis is involved in triapine resistance.

A. Expression of total Epac1 and Rap1 in protein extracts of SW480 vs. SW480/tria cells. B. SW480 and SW480/tria cells were treated with the indicated concentrations of triapine alone and in combination with 007-AM (Epac activator). After 72 h treatment cell viability was determined by MTT assay. The values given are means and SD of one representative experiment out of three performed in triplicate. Statistical analysis was performed by two-way ANOVA (***P < 0.001). C. SW480 and SW480/tria cells were left untreated (control) or exposed to either Epac or scrambled (scr) siRNA (both 25 μM) for 48 h and treated with the indicated concentrations of triapine. After 72 h treatment, cell viability was determined by MTT assay. The values given are means and SD of one representative experiment out of three performed in triplicate. Statistical analysis was performed by two-way ANOVA (***P < 0.001). D. Levels of total and deprenylated Rap1 in SW480 as compared to SW480/tria cells treated with the indicated drugs for 24 h were determined by Western blotting. β-actin was used as loading control. E. SW480 and SW480/tria cells were treated with the indicated concentrations of triapine alone and in combination with zoledronic acid (inhibiting Rap1 prenylation). After 72 h treatment, cell viability was determined by MTT assay. The values given are means ± SD of one representative experiment out of three performed in triplicate. Statistical analysis was performed by two-way ANOVA (***P < 0.001).
