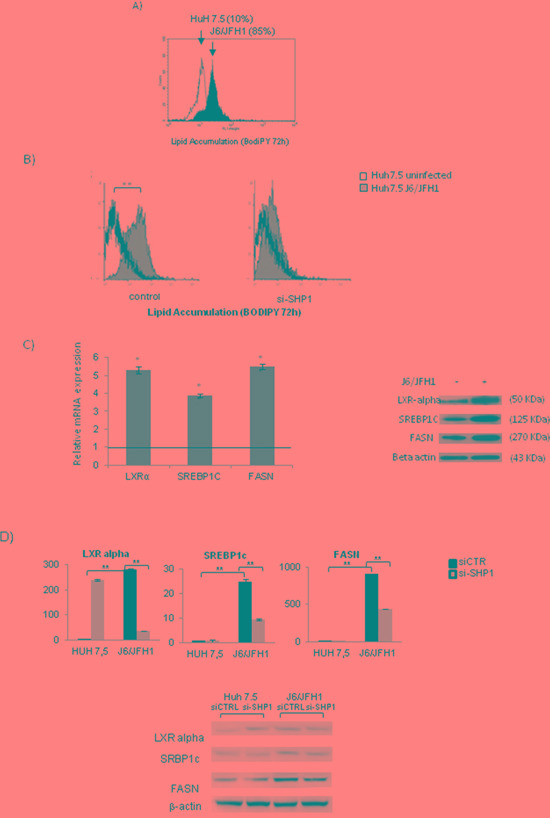
Figure 4. SHP1 and HCV related lipid accumulation.

A. FACS analysis of lipid accumulation (BODIPY) in J6/JFH1 HuH7.5 cells, 72 hours post infection. The results are representative of 3 independent experiments. B. FACS analysis of the effects of SHP1 silencing on cell lipid accumulation (BODIPY) (Huh7.5 J6/JFH1: 65 ± 5.82 vs siSHP1 Huh7.5 J6/JFH1: 3.65±1.32). The results are representative of 3 independent experiments. C. Real-time PCR and WB analyses of LXRα, SREBPc1 and FASN, 72 hrs post infection. The results, derived from 5 independent experiments, and are represented as mean ± S.D, *p<0.05. D. Real-time PCR and WB of LXRα, SREBPc1 and FASN, 72 hrs post-infection, in presence of si-SHP1. The results, derived from 5 independent experiments, are represented as mean ± S.D, **p<0.01.
