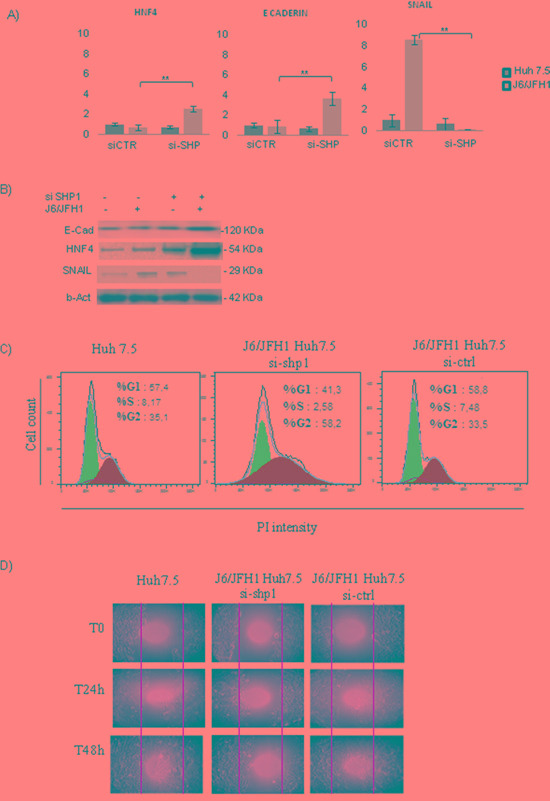
Figure 5. SHP1 and Epithelial Mesenchimal Transition (EMT).

A. Real-time analysis of HNF4, E-Cadherin and SNAIL, in J6/JFH1 HuH7.5, before and after siSHP1. Data derived from three independent experiments, and are expressed as mean values± S.D, **p<0.01. B. WB analysis of HNF4, E-Cadherin and SNAIL, representative of 3 independent experiments. C. FACS analysis of J6/JFH1 HuH7.5 cell cycle, after 48hrs of siSHP1, using propidium iodide (PI) staining. D. In vitro scratch assay, after siSHP1. Representative microphotographs were taken after 24h and 48h from the initial scratch.
