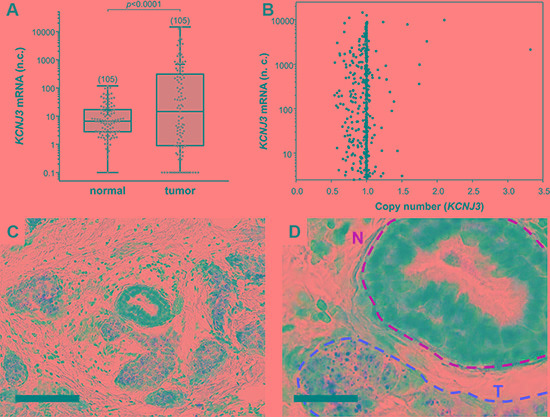
Figure 1. KCNJ3 mRNA levels are higher in tumor than in surrounding normal tissue.

(A) KCNJ3 mRNA expression in normal and corresponding tumor tissue of breast cancer patients of the TCGA. Whiskers represent the lowest and the highest value, single data points are shown by grey circles, the black + marks the mean value. Number of samples analysed is given in brackets above each box. A Wilcoxon signed rank test was used for analysis (p < 0.001); n.c.: normalized counts. (B) KCNJ3 gene copy numbers versus KCNJ3 mRNA expression of breast cancer patients of the TCGA (n = 890). A copy number of 1.0 indicates that no gene amplification or deletion on DNA level has happened. Spearman rank correlation analysis revealed no statistical significant increase or decrease in KCNJ3 gene copy number (rS= -0.0207; not significant); n.c.: normalized counts. (C) KCNJ3 RNA in situ hybridization of a patient sample with high KCNJ3 expression. Positive signals (brown spots) are present in tumor cells only. Scale bar: 100 μm. (D) Detail of (C). N (yellow): normal duct; T (red): tumor area. Scale bar: 25 μm.
