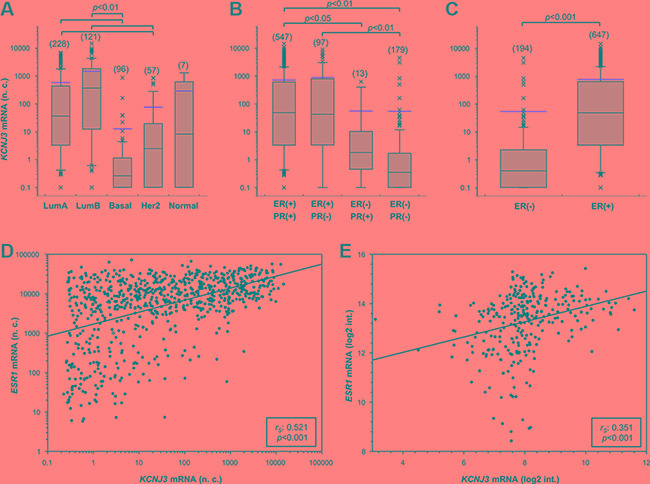
Figure 3. KCNJ3 mRNA levels are upregulated in estrogen receptor positive breast cancer samples.

KCNJ3 mRNA expression levels in breast cancer patient samples of the TCGA according (A) to their PAM50 classification (n = 509), (B) to their estrogen and progesterone receptor status (n = 836), and (C) to their estrogen receptor status (n = 841; p < 0.001). Boxplots: Whiskers represent the 10th and the 90th percentile, crosses represent outliers, and the red line marks the mean value. Number of samples analysed is given in brackets above each box. A Kruskal Wallis test with Dunn's post-hoc tests for pairwise comparison was used for analysis in (A) and (B), and a Wilcoxon rank sum test in (C); p-values are given on top of each plot. (D) Scatter plot of KCNJ3 and ESR1 mRNA expression levels in breast cancer patient samples of the TCGA (n = 905). (E) Scatter plot of KCNJ3 and ESR1 mRNA expression levels in patient samples of the GEO data set GSE17705 (n = 298). Spearman rank correlation coefficients (rS) and p-values are given in the boxes of each plot. n.c.: normalized counts; log2 int.: log2 intensity; LumA: luminal A type; LumB: luminal B type; basal: basal type; Her2: Her2-enriched type; Normal: normal-like type; ER: estrogen receptor; PR: progesterone receptor; (−): negative; (+): positive.
