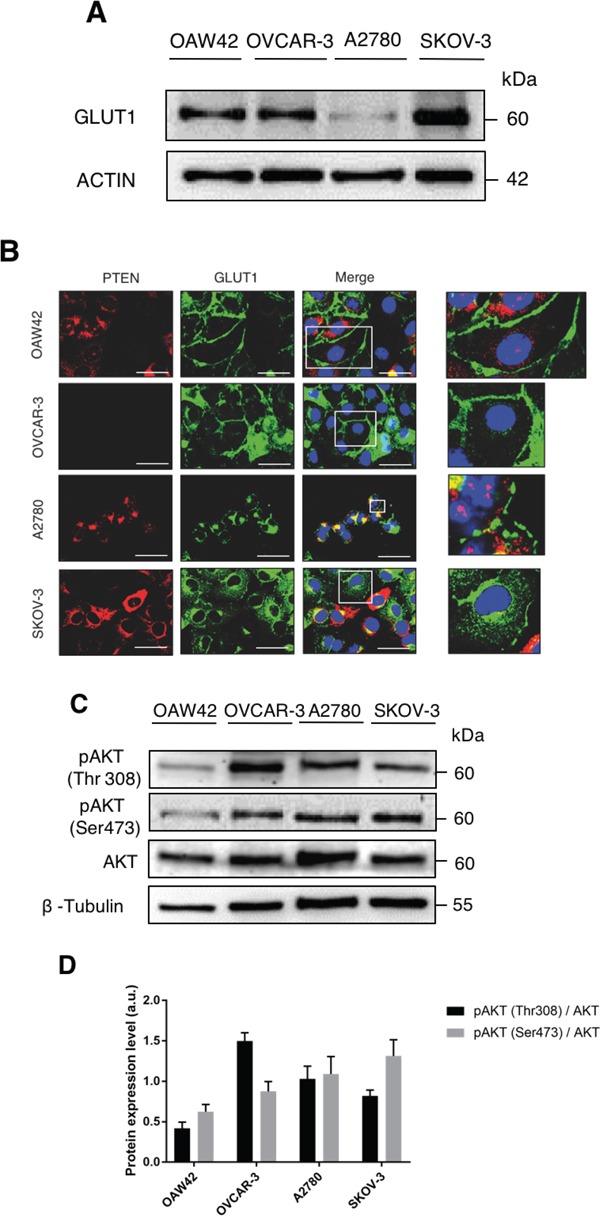
Figure 1. Active AKT promotes cell surface expression of GLUT1.

A. OAW42, OVCAR3, A2780 and SKOV3 ovarian cancer cells were analyzed by Western blot to reveal the basal expression levels of GLUT-1. β-Actin was used as protein loading marker. One out of four western blotting with similar pattern of protein expression is shown. B. The cells were cultured in control media then fixed in ice-cold methanol and co-stained for PTEN and GLUT-1. DAPI (blue) was used to stain nuclei. Scale bar = 20 μM; Magnification = 63X. Representative images of four separate experiments are shown. C. OAW42, OVCAR-3, A2780 and SKOV3 cells were plated and cultured in control media. The lysates were analyzed by Western Blot to reveal the expression levels of active AKT, phosphorylated at threonine 308 and serine 473. β-Tubulin was used as protein loading marker. D. Densitometric evaluation of phosphorylated AKT levels per each cell line (mean + S.E.M of three separate experiments).
