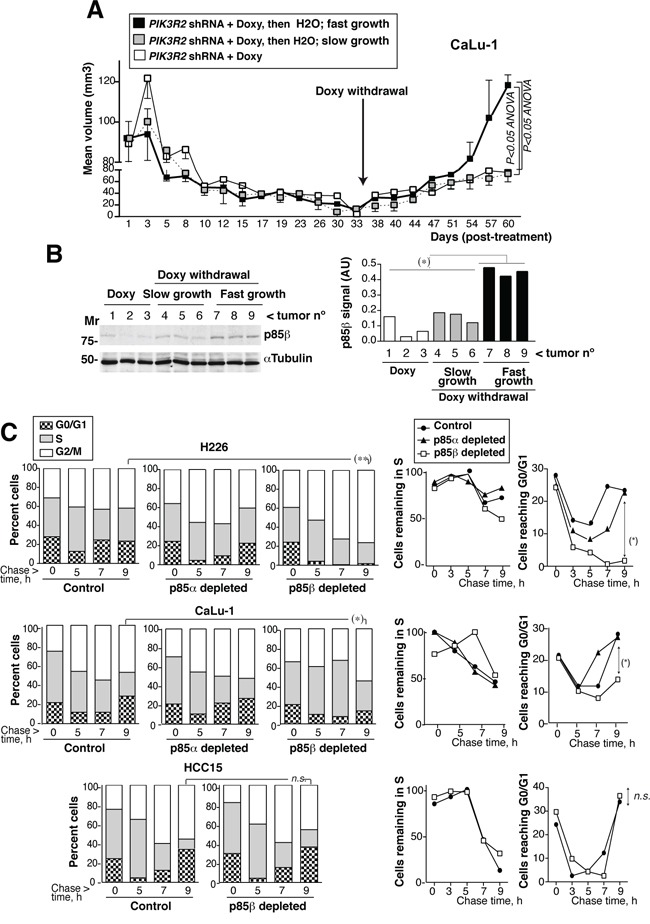
Figure 6. PIK3R2 reconstitution restores SQCC xenograft growth; PIK3R2 depletion decelerates cell cycle progression.

A. Xenografts were established using CaLu-1 cells expressing inducible-PIK3R2 shRNA. When tumors reached a volume ~100 mm3, mice were treated with doxycycline for ~one month, when we randomly divided the animals in two groups. Doxycycline was withdrawn in one of the groups and maintained in the other. Graph shows the Mean ± SEM size of tumors kept in doxycycline (white square) as well as those deprived of the treatment, which were divided in slow- (grey) or fast-growing tumors (black). Differences between groups were analyzed using a 2-way ANOVA test. B. WB confirmed p85β re-expression in fast growing tumors and p85β low levels in the slow-growth tumors. Graph shows p85β signal intensity (corrected for the loading control) in arbitrary units (A.U.). Mr. indicates relative mobility. C. CaLu-1 or H226 cells expressing control, PIK3R1 or PIK3R2 shRNA were cultured alone or with doxycycline (5 μg/ml, 72 h). A non-responsive cell line (HCC15, control) expressing PIK3R2 shRNA was treated similarly. Cells were labeled with BrdU (20 μM, 1h; 90 min in the case of H226) then deprived of BrdU and chased at different times. We examined the percentage of BrdU+ cells that progressed from 2N (G0/G1) to 2-to-4N (S) and to 4N DNA content (G2/M phases) by flow cytometry (Mean percentage, n = 3)(left panels). In the medium panel, we represent the proportion of cells remaining in S phase at different times compared to maximal, considered 100%. Right panels show the percentage of cells in G0/G1 at different times. *P<0.05, differences between cell cycle distribution were examined using Chi square test; percent of S or G0/G1 cells was compared using Student's t test.
