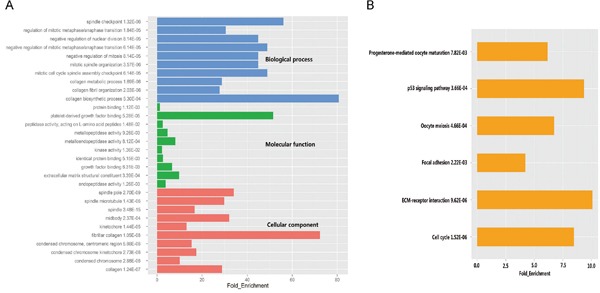
Figure 2. GO and pathway analysis of significant differentially expressed genes.

A. The top ten significantly enriched GO categories were calculated. Blue: Biological process; Green: Molecular function; Red: Cellular component. B. Gene networks identified through KEGG analysis of the differentially expressed genes.
