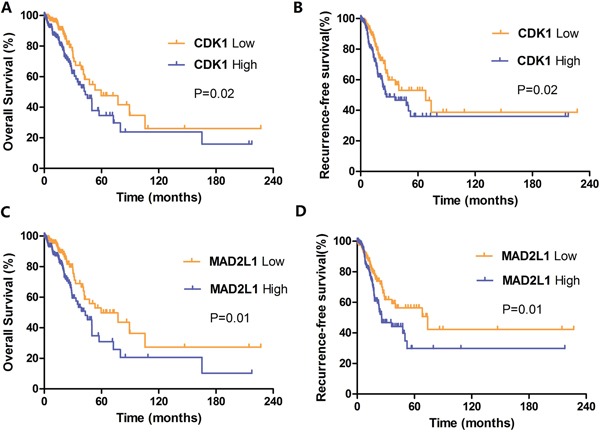
Figure 5. Kaplan-Meier survival curves by different levels of CDK1 and MAD2L1 expression in 349 LUAD patients.

A. Overall survival (OS) by low and high CDK1 expression; B. Relapse-free survival (RFS) by low and high CDK1 expression; C. Overall survival (OS) by low and high MAD2L1 expression; D. Relapse-free survival (RFS) by low and high MAD2L1 expression.
