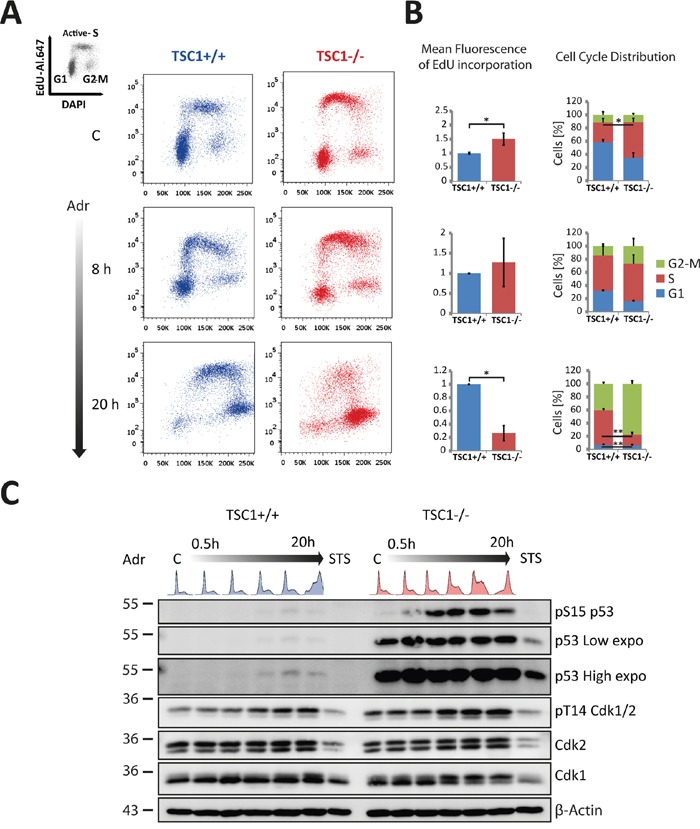
Figure 3. TSC1-/- MEFs feature altered cell cycle distribution, aberrant S-phase progression and G2-M accumulation under mild genotoxic stress.

A. Representative EdU incorporation cell cycle profiles of TSC1+/+ and TSC1-/- MEFs untreated or Adr (0.5 μg/ml) treated for the indicated time-periods. The complete time series is shown in Supplementary Figure S7A. B. Quantification of mean EdU incorporation intensities (left) and mean cell cycle distribution (right) corresponding to A. Notice the recovery of the S-phase arc in the wt MEFs as opposed to the chaotic S-phase arc in TSC1-/- MEFs at 20 h accompanied by the massive G2-M arrest. Over 75 % of TSC1-/- pass through S-phase and accumulate in G2/M. Values are mean + SD. Statistical significance was calculated using two-tailed t-test. * p<0.05, ** p<0.01. A complete series of EdU incorporation profiles for all treatment times is presented in Supplementary Figure S7A. C. Western blot analysis of samples treated for up to 20 h with Adr (0.5 μg/ml). A long exposure of the p53 western is shown to illustrate that p53 does accumulate in wild-type MEF cells, too. Cell cycle patterns are highlighted on top of the lanes to assist interpretation of the blots. STS: Staurosporine (1 μM) serves as a positive control for apoptosis induction.
