
Figure 5. Energetic enrichment in TSC1-/- MEFs alleviates DNA damage accumulation.
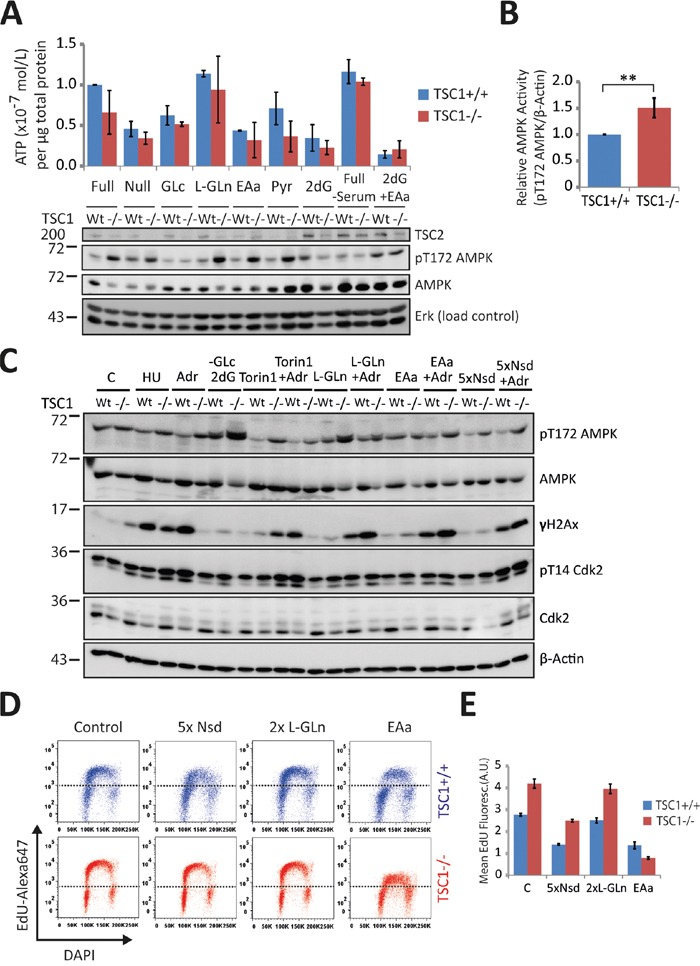
A. Above – Luminometric ATP measurements of TSC1+/+ and TSC1-/- MEFs under diverse growth conditions as indicated for 20 h. Below – Western analysis of duplicate samples. Note that AMPK activity, scored here as phosphorylation at Thr172, reflects the drop in ATP levels, and is consistently high in TSC1-/- MEFs. B. Densitometry of AMPK activity in untreated TSC1+/+ and TSC1-/- MEFs maintained in complete DMEM supplemented with 10 % serum. Notice the higher phosphoT172-AMPK levels (activity) due to the increased anabolic demand imposed by constitutive mTORC1 signalling in TSC1-/- MEFs. Bars are mean ± SD. Statistical significance was calculated using the non-parametric Mann Whitney U test. **p<0.01 C. Western blot of TSC1+/+ and TSC1-/- MEFs cultured for 8h in the presence of the indicated media/supplements. Note that energy deprivation alone does not manifest as spontaneous DNA damage in TSC1-/- MEFs. GLc: Glucose, 2dG: 2-deoxy-Glucose, L-Gln: L-Glutamine, EAa: Amino acids, Nsd – Nucleosides. D. Pulse EdU-incorporation cell cycle profiles of TSC1+/+ and TSC1-/- MEFs subjected to nucleoside supplementation (5xNsd), high-energy substrate-feeding (2xL-Gln) or amino acid feeding (EAa). Dotted black line is arbitrarily placed to aid visualisation of the changes in EdU-incorporation arc heights E. Mean fluorescence of EdU incorporation. Data represent duplicate measurements from one experiment.