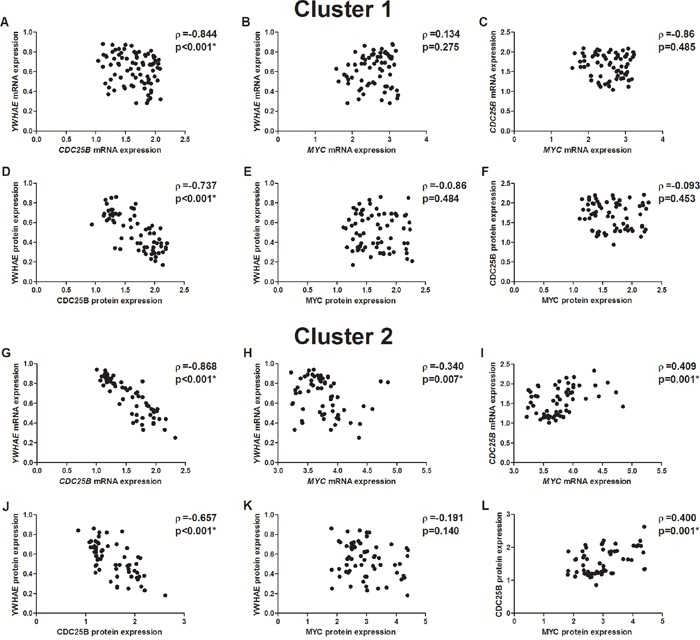
Figure 12. Correlation between mRNA and protein expression in two cluster of gastric cancer samples.

A. YWHAE and CDC25B mRNA expression in the cluster 1. B. YWHAE and MYC mRNA expression in the cluster 1. C. CDC25B and MYC mRNA expression in the cluster 1. D. YWHAE and CDC25B protein expression in the cluster 1. E. YWHAE and MYC protein expression in the cluster 1. F. CDC25B and MYC protein expression in the cluster 1. G. YWHAE and CDC25B mRNA expression in the cluster 2. H. YWHAE and MYC mRNA expression in the cluster 2. I. CDC25B and MYC mRNA expression in the cluster 2. J. YWHAE and CDC25B protein expression in the cluster 2. K. YWHAE and MYC protein expression in the cluster 2. L. CDC25B and MYC protein expression in the cluster 2. Correlation coefficients and p-values of Spearman correlation test are shown. *p<0.05, significant correlation by S Spearman correlation test.
